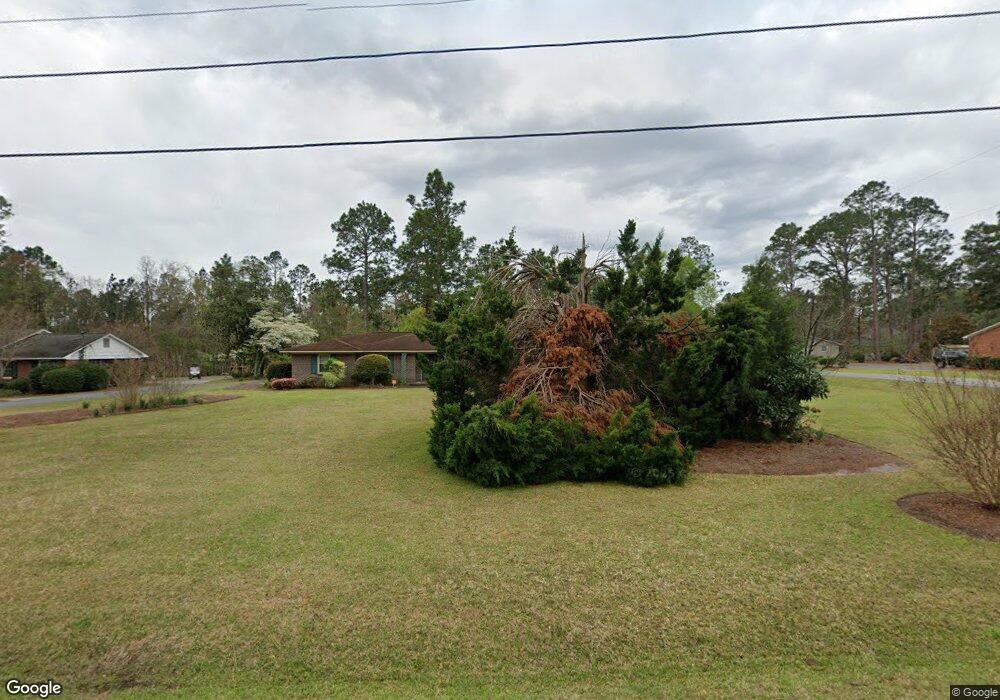
465 Prince Ave Swainsboro, GA 30401
Estimated Value: $217,600 - $325,000
3
Beds
2
Baths
2,248
Sq Ft
$123/Sq Ft
Est. Value
About This Home
This home is located at 465 Prince Ave, Swainsboro, GA 30401 and is currently estimated at $276,650, approximately $123 per square foot. 465 Prince Ave is a home located in Emanuel County with nearby schools including Swainsboro Primary School, Swainsboro Elementary School, and Swainsboro Middle School.
Ownership History
Date
Name
Owned For
Owner Type
Purchase Details
Closed on
Aug 10, 2016
Sold by
Bowen Melany H
Bought by
Averett Michael Shane and Averett Katherine Chance
Current Estimated Value
Home Financials for this Owner
Home Financials are based on the most recent Mortgage that was taken out on this home.
Original Mortgage
$112,800
Outstanding Balance
$89,856
Interest Rate
3.43%
Estimated Equity
$186,794
Purchase Details
Closed on
Aug 5, 2016
Sold by
Melany H
Bought by
Averett Michael Shane
Home Financials for this Owner
Home Financials are based on the most recent Mortgage that was taken out on this home.
Original Mortgage
$112,800
Outstanding Balance
$89,856
Interest Rate
3.43%
Estimated Equity
$186,794
Purchase Details
Closed on
Jan 21, 2005
Sold by
Donaldson William E
Bought by
Bowen Melany H
Purchase Details
Closed on
Oct 5, 1999
Sold by
Johnson Bernice C
Bought by
Johnson Bernice C -
Create a Home Valuation Report for This Property
The Home Valuation Report is an in-depth analysis detailing your home's value as well as a comparison with similar homes in the area
Home Values in the Area
Average Home Value in this Area
Purchase History
| Date | Buyer | Sale Price | Title Company |
|---|---|---|---|
| Averett Michael Shane | -- | -- | |
| Averett Michael Shane | $141,000 | -- | |
| Bowen Melany H | $100,000 | -- | |
| Johnson Bernice C - | -- | -- |
Source: Public Records
Mortgage History
| Date | Status | Borrower | Loan Amount |
|---|---|---|---|
| Open | Averett Michael Shane | $112,800 | |
| Closed | Averett Michael Shane | $112,800 |
Source: Public Records
Tax History Compared to Growth
Tax History
| Year | Tax Paid | Tax Assessment Tax Assessment Total Assessment is a certain percentage of the fair market value that is determined by local assessors to be the total taxable value of land and additions on the property. | Land | Improvement |
|---|---|---|---|---|
| 2024 | $3,112 | $80,688 | $3,956 | $76,732 |
| 2023 | $2,743 | $71,172 | $3,956 | $67,216 |
| 2022 | $1,568 | $65,163 | $3,956 | $61,207 |
| 2021 | $1,492 | $60,917 | $3,440 | $57,477 |
| 2020 | $1,444 | $56,031 | $5,304 | $50,727 |
| 2019 | $1,444 | $56,031 | $5,304 | $50,727 |
| 2018 | $1,488 | $56,281 | $5,304 | $50,977 |
| 2017 | $1,492 | $56,281 | $5,304 | $50,977 |
| 2016 | $1,268 | $54,307 | $5,304 | $49,003 |
| 2015 | -- | $49,810 | $5,304 | $44,506 |
| 2014 | -- | $49,118 | $5,304 | $43,814 |
| 2013 | -- | $53,154 | $5,304 | $47,850 |
Source: Public Records
Map
Nearby Homes
- 508 Barbara Ave
- 532 Kite Rd
- LOT 12 Robin Rd
- 426 W Church St
- 0 S Highway 1 Unit 10340744
- 547 W Moring St
- 0 E Highway 80 Unit 10564175
- 0 E Highway 80 Unit 10498851
- 0 Deer Creek Dr Unit 10373260
- 0 Deer Creek W
- 327 W Church St
- 14.53 ACRES Gumlog Rd
- 532 Calhoun St
- 0 Rd Unit 10512197
- 219 Lucky St
- 555 Mulberry St
- 316 W Moring St
- 555 Jordan Ln
- 402 N Main St
- 625 N Main St
- 459 Prince Ave
- 811 Oaklawn Dr
- 301 Margaret Blvd
- 711 Oaklawn Dr
- 806 Oaklawn Dr
- 453 Prince Ave
- 857 Oaklawn Dr
- 509 Prince Ave
- 817 Oaklawn Dr
- 716 Oaklawn Dr
- 705 Oaklawn Dr
- 704 Oaklawn Dr
- 510 Prince Ave
- 517 Prince Ave
- 518 Margaret Blvd
- 629 Oaklawn Dr
- 0 Prince Ave Unit 8532506
- 0 Prince Ave Unit 7397528
- 0 Prince Ave
- 518 Prince Ave