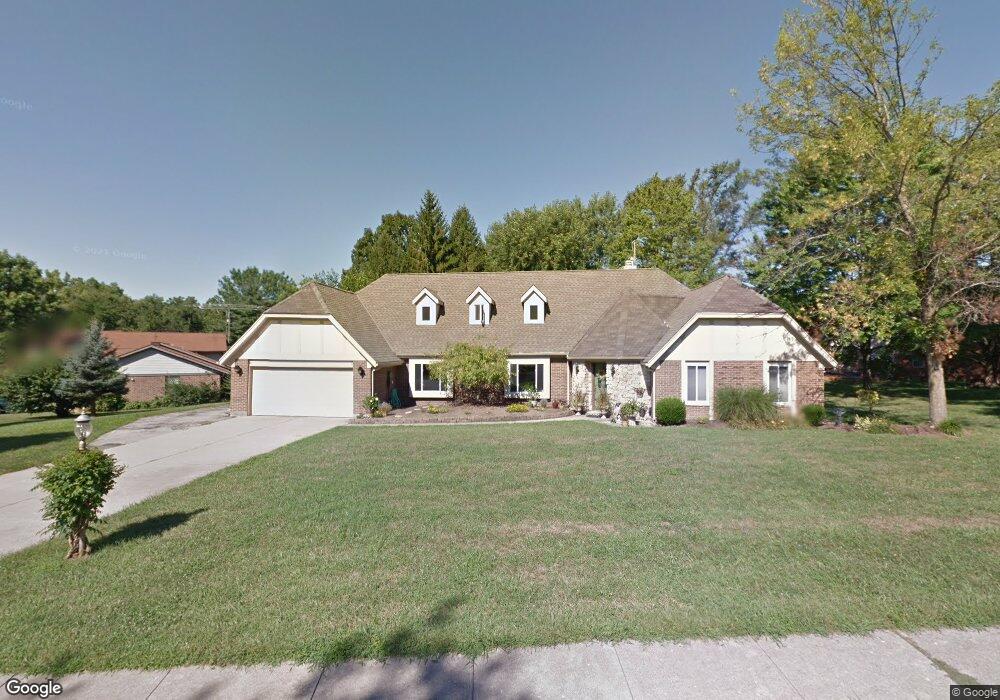
465 Queensgate Rd Springboro, OH 45066
Estimated Value: $388,169 - $432,000
3
Beds
3
Baths
2,756
Sq Ft
$148/Sq Ft
Est. Value
About This Home
This home is located at 465 Queensgate Rd, Springboro, OH 45066 and is currently estimated at $408,292, approximately $148 per square foot. 465 Queensgate Rd is a home located in Warren County with nearby schools including Clearcreek Elementary School, Springboro Intermediate School, and Dennis Elementary School.
Ownership History
Date
Name
Owned For
Owner Type
Purchase Details
Closed on
Dec 7, 1993
Sold by
Wilkerson Wilkerson and Wilkerson Michael R
Bought by
Thomas Thomas and Thomas Joseph J
Current Estimated Value
Purchase Details
Closed on
Aug 12, 1992
Sold by
Montuoro Montuoro and Montuoro James M
Bought by
Wilkerson Wilkerson and Wilkerson Michael R
Purchase Details
Closed on
Jun 3, 1991
Sold by
Smith Robert J and Smith Joann
Bought by
Montuoro and Montuoro James M
Purchase Details
Closed on
Jul 27, 1983
Sold by
Gettysburg Enterprises (P
Bought by
Smith Smith and Smith Robert J
Purchase Details
Closed on
Mar 23, 1983
Sold by
Gem Savings Association
Bought by
Gettysburg Enterprises (P
Purchase Details
Closed on
Sep 28, 1982
Sold by
Oak Manor Homes Inc
Purchase Details
Closed on
Jul 24, 1979
Sold by
Lsm Corp
Purchase Details
Closed on
Jul 25, 1978
Sold by
Lsm Corp
Create a Home Valuation Report for This Property
The Home Valuation Report is an in-depth analysis detailing your home's value as well as a comparison with similar homes in the area
Home Values in the Area
Average Home Value in this Area
Purchase History
| Date | Buyer | Sale Price | Title Company |
|---|---|---|---|
| Thomas Thomas | $163,000 | -- | |
| Wilkerson Wilkerson | $156,800 | -- | |
| Montuoro | $154,000 | -- | |
| Smith Smith | $125,000 | -- | |
| Gettysburg Enterprises (P | $50,000 | -- | |
| -- | $45,500 | -- | |
| -- | $21,400 | -- | |
| -- | -- | -- |
Source: Public Records
Tax History
| Year | Tax Paid | Tax Assessment Tax Assessment Total Assessment is a certain percentage of the fair market value that is determined by local assessors to be the total taxable value of land and additions on the property. | Land | Improvement |
|---|---|---|---|---|
| 2025 | $4,797 | $122,850 | $31,500 | $91,350 |
| 2024 | $4,797 | $122,850 | $31,500 | $91,350 |
| 2023 | $4,114 | $96,621 | $16,940 | $79,681 |
| 2022 | $4,054 | $96,621 | $16,940 | $79,681 |
| 2021 | $3,773 | $96,621 | $16,940 | $79,681 |
| 2020 | $3,566 | $79,853 | $14,000 | $65,853 |
| 2019 | $3,288 | $79,853 | $14,000 | $65,853 |
| 2018 | $3,290 | $79,853 | $14,000 | $65,853 |
| 2017 | $3,130 | $68,415 | $12,250 | $56,165 |
| 2016 | $3,264 | $68,415 | $12,250 | $56,165 |
| 2015 | $3,227 | $68,415 | $12,250 | $56,165 |
| 2014 | $3,227 | $63,940 | $11,450 | $52,490 |
| 2013 | $3,225 | $78,180 | $14,000 | $64,180 |
Source: Public Records
Map
Nearby Homes
- 340 Saint James Place
- 350 Spruceway Dr
- 1101 Parklake Row
- 23 Pheasant Run Cir Unit 9A
- 245 Whispering Pines St
- 1785 Archerfield Place
- 225 Renwood Place
- 11138 Oakwood Village Blvd
- 50 Millard Ct
- 9680 Williams Dr
- 10862 Jandor Place
- 92 Villa Pointe Dr Unit 92
- 70 Eleanor Dr
- 35 Edgebrooke Dr
- 1315 Woodland Greens Blvd
- 490 W Market St
- 85 Meadows Dr
- 4 Chestnut St
- 72 Pebble Brook Place
- 25 Blose Ct
- 455 Queensgate Rd
- 2815 Westminster Way
- 2805 Westminster Way
- 2825 Westminster Way
- 480 Queensgate Rd
- 445 Queensgate Rd
- 470 Queensgate Rd
- 2835 Westminster Way
- 500 Queensgate Rd
- 460 Queensgate Rd
- 450 Queensgate Rd
- 440 Queensgate Rd
- 2845 Westminster Way
- 2820 Westminster Way
- 2810 Westminster Way
- 2800 Westminster Way
- 2775 Westminster Way
- 485 Royal Springs Dr
- 2855 Westminster Way
- 510 Queensgate Rd
Your Personal Tour Guide
Ask me questions while you tour the home.