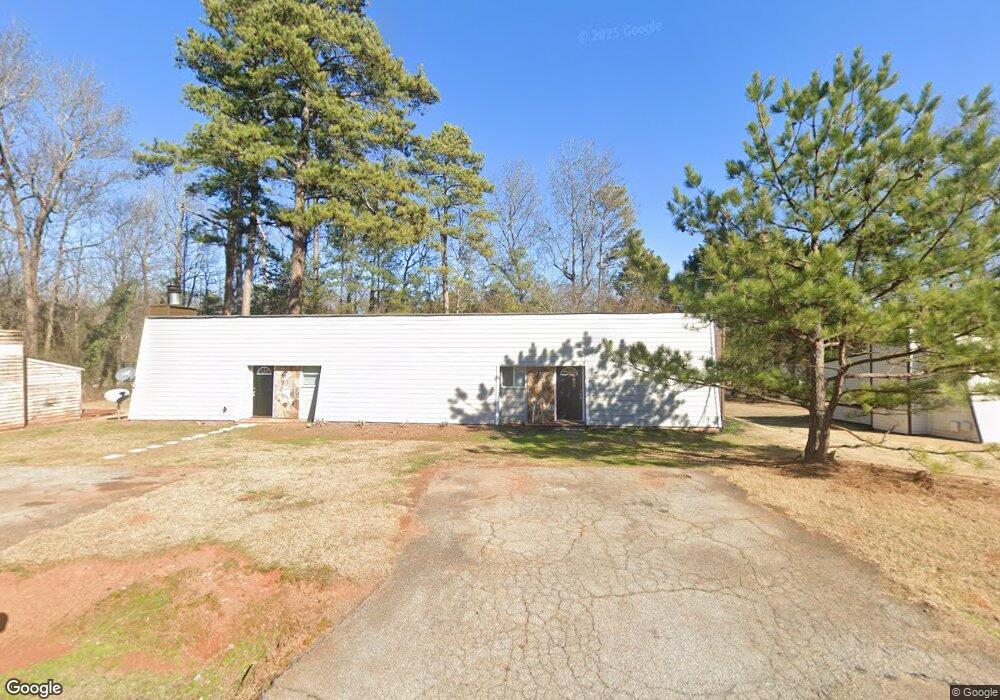
465 Rustwood Dr Athens, GA 30606
Estimated Value: $196,000 - $273,000
2
Beds
1
Bath
1,616
Sq Ft
$152/Sq Ft
Est. Value
About This Home
This home is located at 465 Rustwood Dr, Athens, GA 30606 and is currently estimated at $245,987, approximately $152 per square foot. 465 Rustwood Dr is a home located in Clarke County with nearby schools including Whitehead Road Elementary School, Burney-Harris-Lyons Middle School, and Clarke Central High School.
Ownership History
Date
Name
Owned For
Owner Type
Purchase Details
Closed on
Feb 23, 2024
Sold by
Stewart Robert
Bought by
Better Life Real Estate Llc
Current Estimated Value
Home Financials for this Owner
Home Financials are based on the most recent Mortgage that was taken out on this home.
Original Mortgage
$168,055
Interest Rate
6.69%
Mortgage Type
New Conventional
Purchase Details
Closed on
Aug 25, 2005
Sold by
Waters James R
Bought by
Stewart Robert B
Home Financials for this Owner
Home Financials are based on the most recent Mortgage that was taken out on this home.
Original Mortgage
$51,033
Interest Rate
5.71%
Mortgage Type
New Conventional
Purchase Details
Closed on
Jun 24, 1999
Sold by
Perkins Deana M
Bought by
Waters James R and Waters Sidney A
Purchase Details
Closed on
Oct 6, 1995
Sold by
Jones J Benton
Bought by
Perkins Deana M
Create a Home Valuation Report for This Property
The Home Valuation Report is an in-depth analysis detailing your home's value as well as a comparison with similar homes in the area
Home Values in the Area
Average Home Value in this Area
Purchase History
| Date | Buyer | Sale Price | Title Company |
|---|---|---|---|
| Better Life Real Estate Llc | $163,888 | -- | |
| Stewart Robert B | $70,000 | -- | |
| Waters James R | $44,800 | -- | |
| Perkins Deana M | $44,900 | -- |
Source: Public Records
Mortgage History
| Date | Status | Borrower | Loan Amount |
|---|---|---|---|
| Closed | Better Life Real Estate Llc | $168,055 | |
| Previous Owner | Stewart Robert B | $51,033 |
Source: Public Records
Tax History Compared to Growth
Tax History
| Year | Tax Paid | Tax Assessment Tax Assessment Total Assessment is a certain percentage of the fair market value that is determined by local assessors to be the total taxable value of land and additions on the property. | Land | Improvement |
|---|---|---|---|---|
| 2024 | $2,500 | $70,264 | $12,000 | $58,264 |
| 2023 | $2,196 | $64,069 | $10,400 | $53,669 |
| 2022 | $1,530 | $47,961 | $10,400 | $37,561 |
| 2021 | $1,470 | $43,612 | $10,400 | $33,212 |
| 2020 | $961 | $28,514 | $8,000 | $20,514 |
| 2019 | $966 | $28,459 | $8,000 | $20,459 |
| 2018 | $908 | $26,751 | $6,400 | $20,351 |
| 2017 | $811 | $23,896 | $6,400 | $17,496 |
| 2016 | $657 | $19,343 | $6,400 | $12,943 |
| 2015 | $659 | $19,384 | $6,400 | $12,984 |
| 2014 | $663 | $19,468 | $6,400 | $13,068 |
Source: Public Records
Map
Nearby Homes
- 435 Rustwood Dr
- 530 Rustwood Dr
- 145 Rustwood Dr
- 360 Heather Cove
- 0 Tallassee Rd Unit 1022503
- 0 Tallassee Rd Unit 10415955
- 192 Lakeover Cir
- 139 Lake Forest Dr
- 390 Lakeland Dr
- 283 Lake Vista Way
- 247 Jasmine Trail
- 556 Fuller Rd
- 555 Red Bluff Dr
- 185 Boundary St
- 320 Mizner Blvd
- 11206 Jefferson Rd
- 115 Melbourne Dr
- 457 Rustwood Dr
- 475 Rustwood Dr Unit 475-477
- 475 Rustwood Dr
- 152 Fair Oaks Dr
- 172 Fair Oaks Dr
- 162 Fair Oaks Dr
- 251 Rustwood Dr
- 0 Rustwood Dr Unit 7299583-11835469
- 0 Rustwood Dr Unit 7299583-11726433
- 0 Rustwood Dr Unit 7299583-11707644
- 0 Rustwood Dr Unit 7299583-11684430
- 0 Rustwood Dr Unit 7299583-11652811
- 0 Rustwood Dr Unit 7299583-11604978
- 0 Rustwood Dr Unit 7299583-11474449
- 0 Rustwood Dr Unit 7299583-11209377
- 0 Rustwood Dr Unit 7464516-11177853
- 0 Rustwood Dr Unit 7299583-10967740
- 0 Rustwood Dr Unit 3133031
- 0 Rustwood Dr Unit 8615866
- 0 Rustwood Dr Unit 8291188