Estimated Value: $139,000 - $239,000
2
Beds
2
Baths
1,298
Sq Ft
$151/Sq Ft
Est. Value
About This Home
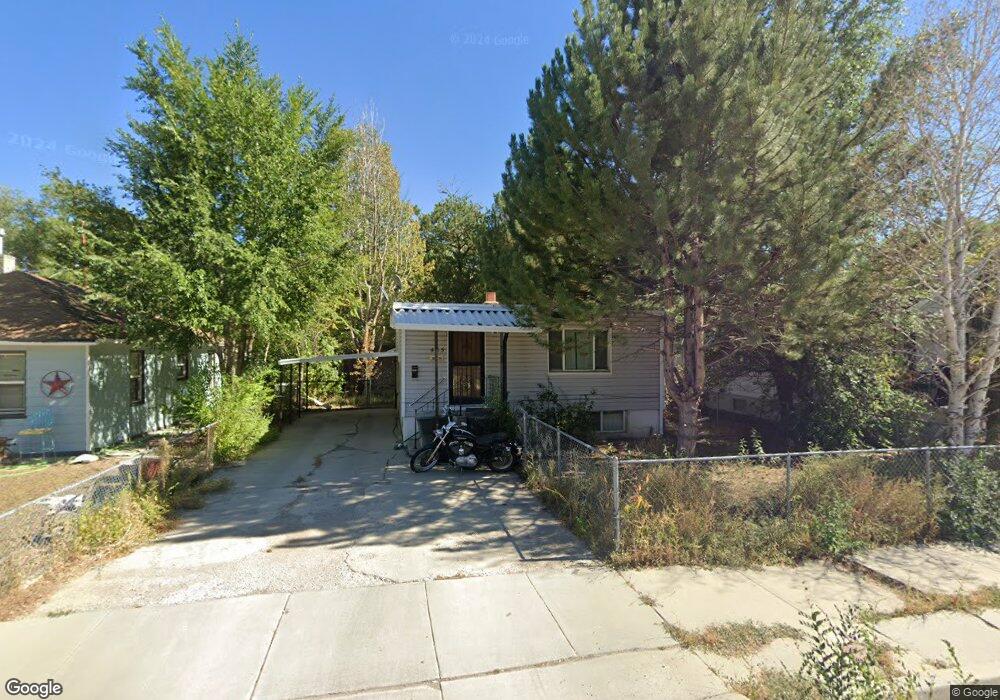
This home is located at 465 S 100 W, Price, UT 84501 and is currently estimated at $195,764, approximately $150 per square foot. 465 S 100 W is a home located in Carbon County with nearby schools including Creekview School, Mont Harmon Junior High School, and Carbon High School.
Ownership History
Date
Name
Owned For
Owner Type
Purchase Details
Closed on
Dec 15, 2021
Sold by
Jake Hansen and Jake Stephanie Hansen
Bought by
Cash Quarter Horses Llc
Current Estimated Value
Purchase Details
Closed on
Feb 23, 2021
Sold by
Hansen Stephanie
Bought by
Hansen Jake and Hansen Stephanie
Home Financials for this Owner
Home Financials are based on the most recent Mortgage that was taken out on this home.
Original Mortgage
$67,500
Interest Rate
2.7%
Mortgage Type
New Conventional
Purchase Details
Closed on
Jun 21, 2019
Sold by
Duke Dayton
Bought by
Dayton Daniel
Purchase Details
Closed on
Feb 22, 2012
Sold by
Dayton Daniel and Dayton Erundina
Bought by
Dayton Duke
Purchase Details
Closed on
Jun 20, 2011
Sold by
Dayton Daniel
Bought by
Dayton Duke
Purchase Details
Closed on
Dec 30, 2009
Sold by
Dayton Daniel
Bought by
Dayton Daniel and Dayton Erundina M
Create a Home Valuation Report for This Property
The Home Valuation Report is an in-depth analysis detailing your home's value as well as a comparison with similar homes in the area
Home Values in the Area
Average Home Value in this Area
Purchase History
| Date | Buyer | Sale Price | Title Company |
|---|---|---|---|
| Cash Quarter Horses Llc | -- | South Eastern Utah Title Co | |
| Hansen Jake | -- | South Eastern Utah Title Co | |
| Dayton Daniel | -- | United West Title | |
| Dayton Duke | -- | -- | |
| Dayton Duke | -- | -- | |
| Dayton Daniel | -- | None Available |
Source: Public Records
Mortgage History
| Date | Status | Borrower | Loan Amount |
|---|---|---|---|
| Previous Owner | Hansen Jake | $67,500 |
Source: Public Records
Tax History Compared to Growth
Tax History
| Year | Tax Paid | Tax Assessment Tax Assessment Total Assessment is a certain percentage of the fair market value that is determined by local assessors to be the total taxable value of land and additions on the property. | Land | Improvement |
|---|---|---|---|---|
| 2025 | $667 | $54,863 | $7,499 | $47,364 |
| 2024 | $692 | $57,593 | $9,075 | $48,518 |
| 2023 | $875 | $77,664 | $8,347 | $69,317 |
| 2022 | $912 | $72,641 | $6,940 | $65,701 |
| 2021 | $786 | $97,165 | $10,603 | $86,562 |
| 2020 | $772 | $47,878 | $0 | $0 |
| 2019 | $688 | $44,734 | $0 | $0 |
| 2018 | $565 | $37,498 | $0 | $0 |
| 2017 | $558 | $37,498 | $0 | $0 |
| 2016 | $503 | $37,498 | $0 | $0 |
| 2015 | $503 | $37,498 | $0 | $0 |
| 2014 | $500 | $37,498 | $0 | $0 |
| 2013 | $465 | $34,568 | $0 | $0 |
Source: Public Records
Map
Nearby Homes
- 80 W 500 S
- 280 W 500 S
- 328 S Carbon Ave
- 410 Rose Ave
- 7700 Us Highway 6
- 235 S 300 W
- 558 E 200 S
- 303 W Railroad Ave
- 2866 S 150 E
- 333 W Railroad Ave
- 669 W 200 S
- 1101 S Carbon Ave Unit 29
- 1101 S Carbon Ave Unit 109
- 1101 S Carbon Ave Unit 75
- 1101 S Carbon Ave Unit 70
- 1101 S Carbon Ave Unit 24
- 1101 S Carbon Ave Unit 39
- 230 E 100 S
- 144 S 300 E
- 495 S Fairgrounds Rd