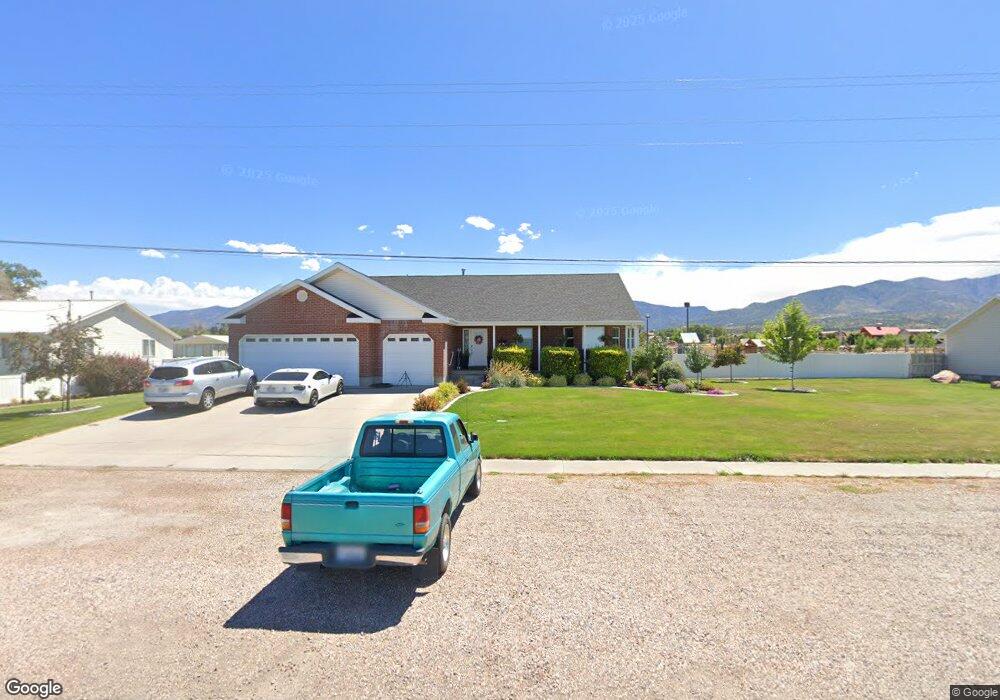
465 S 400 W Fillmore, UT 84631
Estimated Value: $462,000 - $643,117
5
Beds
3
Baths
3,942
Sq Ft
$140/Sq Ft
Est. Value
About This Home
This home is located at 465 S 400 W, Fillmore, UT 84631 and is currently estimated at $550,779, approximately $139 per square foot. 465 S 400 W is a home located in Millard County.
Ownership History
Date
Name
Owned For
Owner Type
Purchase Details
Closed on
Nov 6, 2020
Sold by
Harrison Canisha
Bought by
Harrison Shane
Current Estimated Value
Home Financials for this Owner
Home Financials are based on the most recent Mortgage that was taken out on this home.
Original Mortgage
$328,000
Outstanding Balance
$290,538
Interest Rate
2.8%
Mortgage Type
New Conventional
Estimated Equity
$260,241
Purchase Details
Closed on
Apr 9, 2014
Sold by
Shane Shane and Harrison Canisha
Bought by
Harrison Shane and Harrison Canisha
Home Financials for this Owner
Home Financials are based on the most recent Mortgage that was taken out on this home.
Original Mortgage
$274,928
Interest Rate
4.25%
Mortgage Type
FHA
Purchase Details
Closed on
Mar 25, 2014
Sold by
Melanie A Melanie A
Bought by
Harrison Shane and Harrison Canisha
Home Financials for this Owner
Home Financials are based on the most recent Mortgage that was taken out on this home.
Original Mortgage
$274,928
Interest Rate
4.25%
Mortgage Type
FHA
Purchase Details
Closed on
Oct 14, 2011
Sold by
Slavens James K
Bought by
Slavens James K and Slavens Melanie A
Home Financials for this Owner
Home Financials are based on the most recent Mortgage that was taken out on this home.
Original Mortgage
$200,000
Interest Rate
4.01%
Mortgage Type
New Conventional
Purchase Details
Closed on
Jan 25, 2007
Sold by
Redd Beverly
Bought by
Slavens James K
Create a Home Valuation Report for This Property
The Home Valuation Report is an in-depth analysis detailing your home's value as well as a comparison with similar homes in the area
Home Values in the Area
Average Home Value in this Area
Purchase History
| Date | Buyer | Sale Price | Title Company |
|---|---|---|---|
| Harrison Shane | -- | First American Title | |
| Harrison Shane | -- | First American Title | |
| Harrison Shane | -- | First American Title | |
| Slavens James K | -- | -- | |
| Slavens James K | -- | -- | |
| Slavens James K | -- | -- |
Source: Public Records
Mortgage History
| Date | Status | Borrower | Loan Amount |
|---|---|---|---|
| Open | Harrison Shane | $328,000 | |
| Closed | Harrison Shane | $274,928 | |
| Previous Owner | Slavens James K | $200,000 |
Source: Public Records
Tax History Compared to Growth
Tax History
| Year | Tax Paid | Tax Assessment Tax Assessment Total Assessment is a certain percentage of the fair market value that is determined by local assessors to be the total taxable value of land and additions on the property. | Land | Improvement |
|---|---|---|---|---|
| 2025 | $2,946 | $370,067 | $64,240 | $305,827 |
| 2024 | $2,946 | $349,841 | $70,604 | $279,237 |
| 2023 | $3,648 | $349,841 | $70,604 | $279,237 |
| 2022 | $3,289 | $295,366 | $70,055 | $225,311 |
| 2021 | $2,830 | $243,979 | $45,491 | $198,488 |
| 2020 | $2,474 | $214,548 | $41,355 | $173,193 |
| 2019 | $2,120 | $184,386 | $41,355 | $143,031 |
| 2018 | $2,000 | $178,037 | $41,355 | $136,682 |
| 2017 | $1,855 | $156,969 | $37,890 | $119,079 |
| 2016 | $1,774 | $156,969 | $37,890 | $119,079 |
| 2015 | $1,775 | $156,969 | $37,890 | $119,079 |
| 2014 | -- | $155,594 | $37,890 | $117,704 |
| 2013 | -- | $155,594 | $37,890 | $117,704 |
Source: Public Records
Map
Nearby Homes