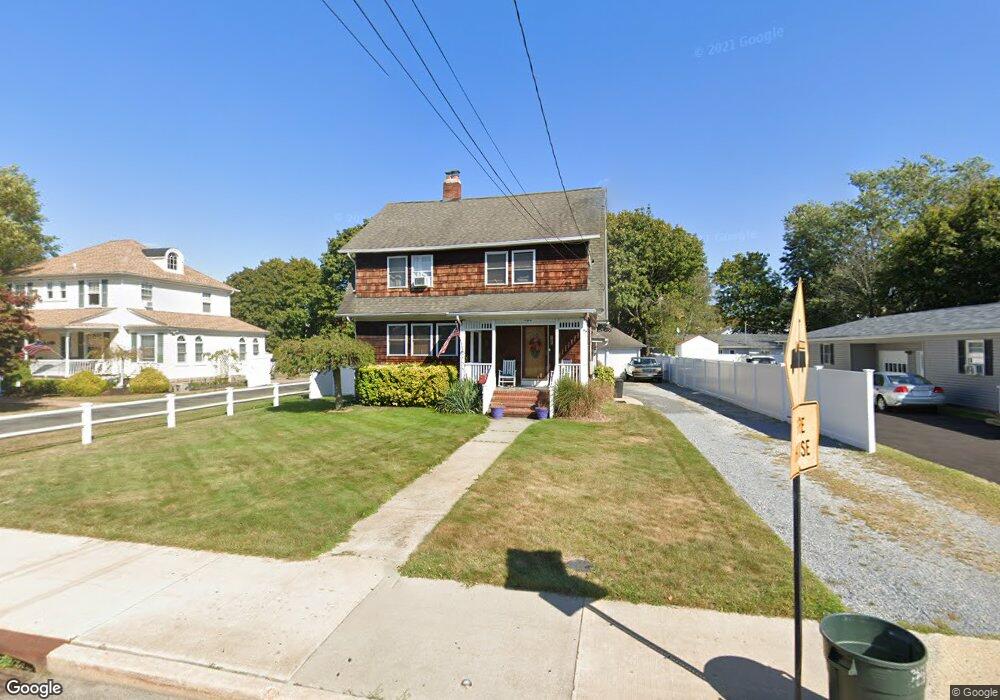
465 S Ocean Ave Patchogue, NY 11772
Estimated Value: $560,000 - $670,000
4
Beds
2
Baths
1,926
Sq Ft
$328/Sq Ft
Est. Value
About This Home
This home is located at 465 S Ocean Ave, Patchogue, NY 11772 and is currently estimated at $632,346, approximately $328 per square foot. 465 S Ocean Ave is a home located in Suffolk County with nearby schools including Patchogue-Medford High School and Holy Angels Regional School.
Ownership History
Date
Name
Owned For
Owner Type
Purchase Details
Closed on
Aug 22, 2016
Sold by
Keenan Kenneth and Keenan Rebecca
Bought by
Weber Jonathan and Frawley Tara Ann
Current Estimated Value
Home Financials for this Owner
Home Financials are based on the most recent Mortgage that was taken out on this home.
Original Mortgage
$279,000
Outstanding Balance
$222,394
Interest Rate
3.45%
Mortgage Type
New Conventional
Estimated Equity
$409,952
Purchase Details
Closed on
Oct 9, 2003
Sold by
Incorporated Village Of Patchogue
Bought by
Keenan Kenneth and Keenan Rebecca
Home Financials for this Owner
Home Financials are based on the most recent Mortgage that was taken out on this home.
Original Mortgage
$145,950
Interest Rate
6.05%
Mortgage Type
Unknown
Purchase Details
Closed on
Feb 27, 2002
Sold by
County Of Suffolk
Bought by
Incorporated Village Of Patchogue
Create a Home Valuation Report for This Property
The Home Valuation Report is an in-depth analysis detailing your home's value as well as a comparison with similar homes in the area
Home Values in the Area
Average Home Value in this Area
Purchase History
| Date | Buyer | Sale Price | Title Company |
|---|---|---|---|
| Weber Jonathan | $310,000 | None Available | |
| Keenan Kenneth | $206,000 | Safe Harbor Title Agency Ltd | |
| Incorporated Village Of Patchogue | -- | -- |
Source: Public Records
Mortgage History
| Date | Status | Borrower | Loan Amount |
|---|---|---|---|
| Open | Weber Jonathan | $279,000 | |
| Previous Owner | Keenan Kenneth | $145,950 | |
| Previous Owner | Keenan Kenneth | $7,000 |
Source: Public Records
Tax History
| Year | Tax Paid | Tax Assessment Tax Assessment Total Assessment is a certain percentage of the fair market value that is determined by local assessors to be the total taxable value of land and additions on the property. | Land | Improvement |
|---|---|---|---|---|
| 2024 | $13,285 | $2,600 | $600 | $2,000 |
| 2023 | $10,396 | $2,600 | $600 | $2,000 |
| 2022 | $9,287 | $2,600 | $600 | $2,000 |
| 2021 | $9,287 | $2,600 | $600 | $2,000 |
| 2020 | $12,263 | $2,600 | $600 | $2,000 |
| 2019 | $12,228 | $0 | $0 | $0 |
| 2018 | $8,959 | $2,600 | $600 | $2,000 |
| 2017 | $8,959 | $2,600 | $600 | $2,000 |
| 2016 | $7,596 | $2,600 | $600 | $2,000 |
| 2015 | -- | $2,600 | $600 | $2,000 |
| 2014 | -- | $2,600 | $600 | $2,000 |
Source: Public Records
Map
Nearby Homes
- 358 Rider Ave
- 255 Cedar Ave
- 808 Emily Dr
- 361 Rider Ave
- 32 Pearl St
- 50 Furman Ln
- 25 Patchogue St
- Arlington Patchogue St
- 247 Rider Ave
- 20 Brightwood St
- 296 Bay Ave
- 51 Marvin St
- 73 Brightwood St
- 43 Wiggins Ave
- 109 Laurel St
- 89 Cedar Ave
- 21 Potter St
- 215 West Ave
- 263 River Ave Unit 16AU
- 263 River Ave Unit 5LD - Building 1
Your Personal Tour Guide
Ask me questions while you tour the home.