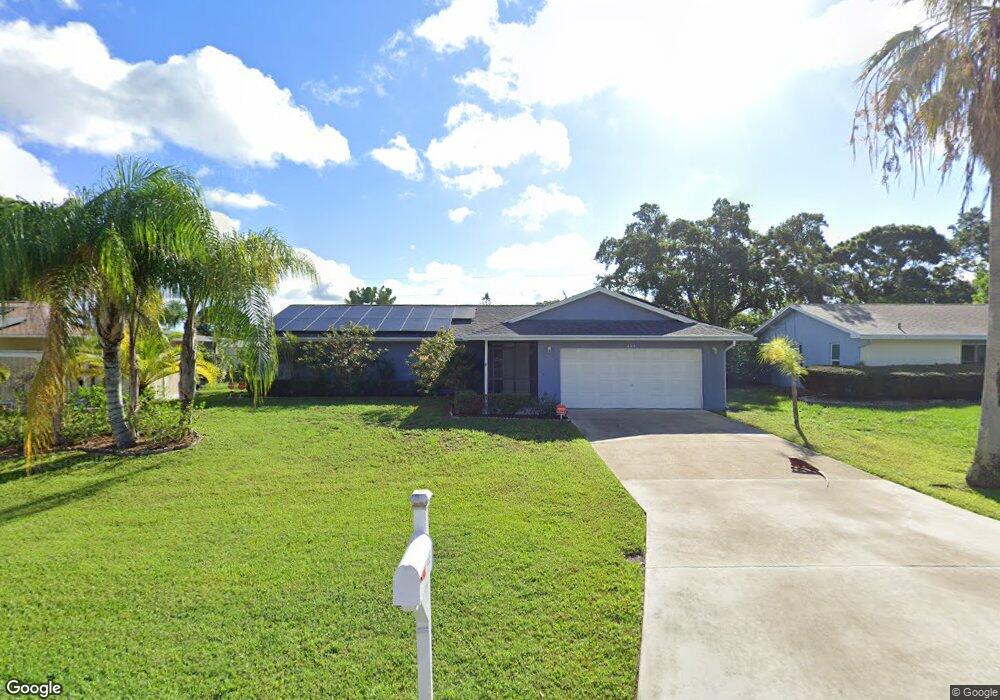
465 SE Asbury Ln Port Saint Lucie, FL 34983
Riverview NeighborhoodEstimated Value: $315,000 - $364,000
3
Beds
2
Baths
1,436
Sq Ft
$235/Sq Ft
Est. Value
About This Home
This home is located at 465 SE Asbury Ln, Port Saint Lucie, FL 34983 and is currently estimated at $337,547, approximately $235 per square foot. 465 SE Asbury Ln is a home located in St. Lucie County with nearby schools including Northport K-8 School, Floresta Elementary School, and Parkway Elementary School.
Ownership History
Date
Name
Owned For
Owner Type
Purchase Details
Closed on
Jul 15, 2024
Sold by
Deyo Mary K
Bought by
Deyo Mary K and Kokinchak Heather M
Current Estimated Value
Purchase Details
Closed on
Aug 12, 2021
Sold by
Vizzo Patricia and Vizzo Vincent A
Bought by
Deyo George W and Deyo Mary K
Home Financials for this Owner
Home Financials are based on the most recent Mortgage that was taken out on this home.
Original Mortgage
$184,000
Interest Rate
2.9%
Mortgage Type
New Conventional
Purchase Details
Closed on
Aug 10, 2021
Sold by
Cruite James
Bought by
Vizzo Patricia
Home Financials for this Owner
Home Financials are based on the most recent Mortgage that was taken out on this home.
Original Mortgage
$184,000
Interest Rate
2.9%
Mortgage Type
New Conventional
Purchase Details
Closed on
Dec 23, 2008
Sold by
Vizzo Vincent A and Vizzo Patricia
Bought by
Vizzo Patricia and Sullivan Margaret C
Create a Home Valuation Report for This Property
The Home Valuation Report is an in-depth analysis detailing your home's value as well as a comparison with similar homes in the area
Home Values in the Area
Average Home Value in this Area
Purchase History
| Date | Buyer | Sale Price | Title Company |
|---|---|---|---|
| Deyo Mary K | $100 | None Listed On Document | |
| Deyo Mary K | $100 | None Listed On Document | |
| Deyo George W | $230,000 | Attorney | |
| Vizzo Patricia | -- | Attorney | |
| Vizzo Patricia | -- | None Available |
Source: Public Records
Mortgage History
| Date | Status | Borrower | Loan Amount |
|---|---|---|---|
| Previous Owner | Deyo George W | $184,000 |
Source: Public Records
Tax History Compared to Growth
Tax History
| Year | Tax Paid | Tax Assessment Tax Assessment Total Assessment is a certain percentage of the fair market value that is determined by local assessors to be the total taxable value of land and additions on the property. | Land | Improvement |
|---|---|---|---|---|
| 2024 | $5,192 | $250,584 | -- | -- |
| 2023 | $5,192 | $243,286 | $0 | $0 |
| 2022 | $5,018 | $236,200 | $105,000 | $131,200 |
| 2021 | $4,105 | $179,300 | $60,000 | $119,300 |
| 2020 | $3,839 | $160,000 | $48,000 | $112,000 |
| 2019 | $3,678 | $157,400 | $42,000 | $115,400 |
| 2018 | $3,277 | $141,800 | $34,000 | $107,800 |
| 2017 | $3,054 | $127,600 | $28,000 | $99,600 |
| 2016 | $2,775 | $105,100 | $21,600 | $83,500 |
| 2015 | $2,504 | $81,200 | $14,800 | $66,400 |
| 2014 | $2,213 | $71,609 | $0 | $0 |
Source: Public Records
Map
Nearby Homes
- 440 SE Sunnydale Ln
- 649 SE Calmoso Dr
- 458 SE Galleon Ln
- 561 SE Marydale Terrace
- 590 SE Anchor Ln
- 573 SE Floresta Dr
- 607 SE Forgal St
- 553 SE Floresta Dr
- 691 SE Harbor View Terrace
- 566 SE Floresta Dr
- 765 SE Floresta Dr
- 777 SE Arton Ln
- 770 SE Hollahan Ave
- 880 SE Degan Dr
- 733 SE Hidden River Dr
- 751 SE Whitehurst Ave
- 188 SE Naranja Ave
- 742 SE Whitehurst Ave
- 289 SE Verada Ave
- 189 SE Floresta Dr
- 471 SE Asbury Ln
- 459 SE Asbury Ln
- 464 SE Sunnydale Ln
- 470 SE Sunnydale Ln
- 477 SE Asbury Ln
- 453 SE Asbury Ln
- 458 SE Sunnydale Ln
- 458 SE Asbury Ln
- 464 SE Asbury Ln
- 452 SE Sunnydale Ln
- 476 SE Sunnydale Ln
- 452 SE Asbury Ln
- 470 SE Asbury Ln
- 447 SE Asbury Ln
- 483 SE Asbury Ln
- 446 SE Asbury Ln
- 446 SE Sunnydale Ln
- 482 SE Sunnydale Ln
- 656 SE Calmoso Dr
- 465 SE Sunnydale Ln