Estimated Value: $493,000 - $530,000
4
Beds
3
Baths
2,821
Sq Ft
$181/Sq Ft
Est. Value
About This Home
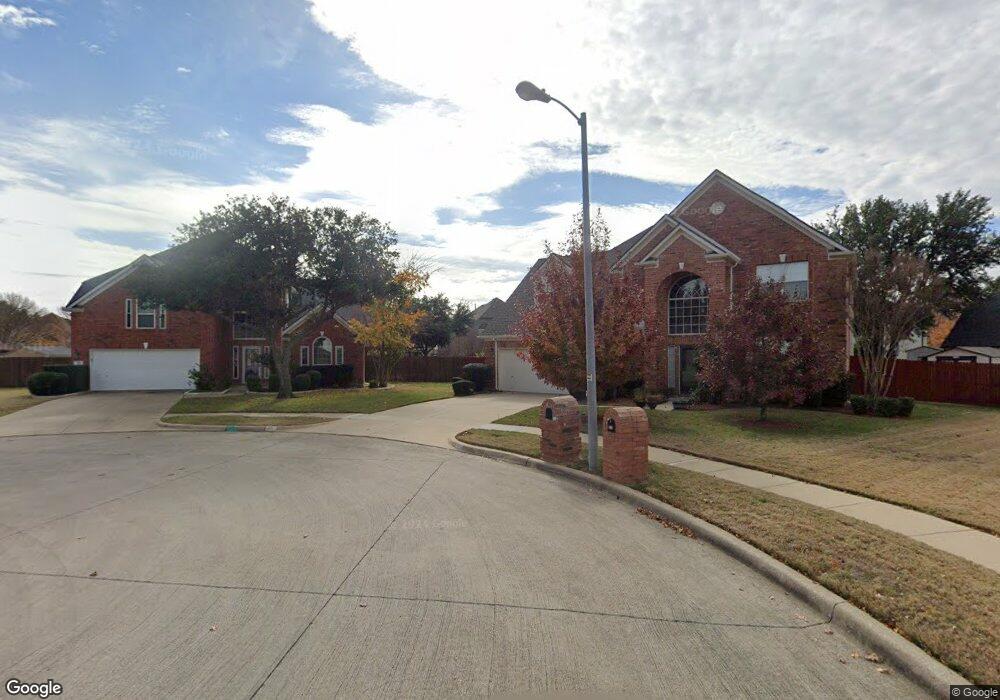
This home is located at 465 Shade Tree Ct, Hurst, TX 76054 and is currently estimated at $509,770, approximately $180 per square foot. 465 Shade Tree Ct is a home located in Tarrant County with nearby schools including Shady Oaks Elementary School, Bedford Junior High School, and L.D. Bell High School.
Ownership History
Date
Name
Owned For
Owner Type
Purchase Details
Closed on
May 17, 2017
Sold by
Ashcarft Richard and Ashcarft Anna
Bought by
Smith Micelle D and Smith Jeremy S
Current Estimated Value
Home Financials for this Owner
Home Financials are based on the most recent Mortgage that was taken out on this home.
Original Mortgage
$240,000
Outstanding Balance
$199,590
Interest Rate
4.1%
Mortgage Type
New Conventional
Estimated Equity
$310,180
Purchase Details
Closed on
Nov 10, 1993
Sold by
The Ryland Group Inc
Bought by
Ashcraft Richard and Ashcraft Anna
Create a Home Valuation Report for This Property
The Home Valuation Report is an in-depth analysis detailing your home's value as well as a comparison with similar homes in the area
Home Values in the Area
Average Home Value in this Area
Purchase History
| Date | Buyer | Sale Price | Title Company |
|---|---|---|---|
| Smith Micelle D | -- | None Available | |
| Ashcraft Richard | -- | -- |
Source: Public Records
Mortgage History
| Date | Status | Borrower | Loan Amount |
|---|---|---|---|
| Open | Smith Micelle D | $240,000 |
Source: Public Records
Tax History
| Year | Tax Paid | Tax Assessment Tax Assessment Total Assessment is a certain percentage of the fair market value that is determined by local assessors to be the total taxable value of land and additions on the property. | Land | Improvement |
|---|---|---|---|---|
| 2025 | $6,383 | $460,000 | $90,000 | $370,000 |
| 2024 | $6,383 | $524,254 | $90,000 | $434,254 |
| 2023 | $7,290 | $441,354 | $90,000 | $351,354 |
| 2022 | $7,617 | $430,597 | $90,000 | $340,597 |
| 2021 | $7,253 | $300,743 | $90,000 | $210,743 |
| 2020 | $7,236 | $300,743 | $90,000 | $210,743 |
| 2019 | $7,361 | $300,743 | $90,000 | $210,743 |
| 2018 | $7,217 | $325,942 | $90,000 | $235,942 |
| 2017 | $6,764 | $341,890 | $35,000 | $306,890 |
| 2016 | $6,149 | $303,176 | $35,000 | $268,176 |
| 2015 | $5,250 | $220,900 | $25,000 | $195,900 |
| 2014 | $5,250 | $220,900 | $25,000 | $195,900 |
Source: Public Records
Map
Nearby Homes
- 404 Mountainview Dr
- 421 Cavender Ct
- 440 W Louella Dr
- 1913 Yucca Trail
- 413 Baker Dr
- 600 Circleview Dr N
- 1905 Cimarron Trail
- 617 Indian Trail
- 612 Circleview Dr S
- 317 Northglen Dr
- 2204 Mountainview Dr
- 201 W Louella Dr
- 2157 Lookout Ct
- 1613 Green Tree Dr
- 201 Hillview Dr
- 532 Plainview Dr
- 2221 Farrington Ln
- 1625 Oak Creek Dr
- 2244 Hurstview Dr
- 412 Elisha Dr
- 461 Shade Tree Ct
- 469 Shade Tree Ct
- 413 Shade Tree Cir
- 409 Shade Tree Cir
- 417 Shade Tree Cir
- 457 Shade Tree Ct
- 401 Shade Tree Cir
- 405 Shade Tree Cir
- 425 Shade Tree Cir
- 429 Shade Tree Cir
- 481 Shade Tree Cir
- 421 Shade Tree Cir
- 473 Shade Tree Cir
- 453 Shade Tree Cir
- 433 Shade Tree Cir
- 477 Shade Tree Cir
- 449 Shade Tree Cir
- 420 Shade Tree Cir
- 424 Shade Tree Cir
- 416 Shade Tree Cir
Your Personal Tour Guide
Ask me questions while you tour the home.