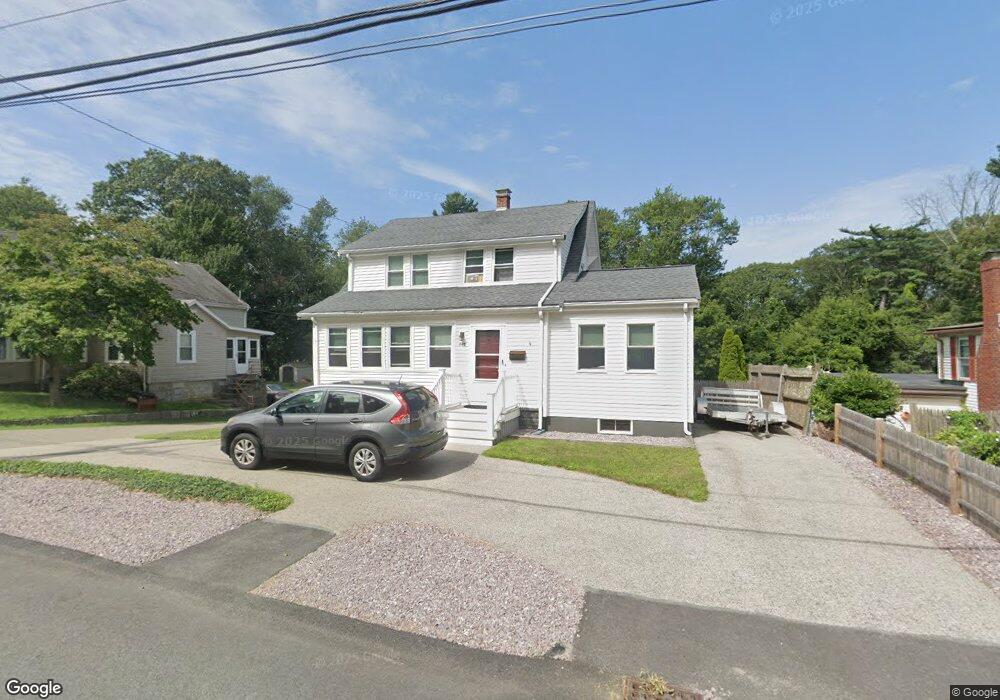
465 Summer St Weymouth, MA 02188
South Weymouth NeighborhoodEstimated Value: $587,499 - $675,000
--
Bed
1
Bath
1,529
Sq Ft
$423/Sq Ft
Est. Value
About This Home
This home is located at 465 Summer St, Weymouth, MA 02188 and is currently estimated at $646,875, approximately $423 per square foot. 465 Summer St is a home located in Norfolk County with nearby schools including Frederick C Murphy, Abigail Adams Middle School, and Weymouth Middle School Chapman.
Ownership History
Date
Name
Owned For
Owner Type
Purchase Details
Closed on
Dec 10, 2024
Sold by
Donovan David S and Donovan Sheila M
Bought by
Donovan Ft and Donovan
Current Estimated Value
Purchase Details
Closed on
Apr 25, 1991
Sold by
Hibernia Sb
Bought by
Donovan David S and Donovan Sheila M
Purchase Details
Closed on
Dec 22, 1987
Sold by
Germain Joseph R
Bought by
Wyatt Roy D
Create a Home Valuation Report for This Property
The Home Valuation Report is an in-depth analysis detailing your home's value as well as a comparison with similar homes in the area
Home Values in the Area
Average Home Value in this Area
Purchase History
| Date | Buyer | Sale Price | Title Company |
|---|---|---|---|
| Donovan Ft | -- | None Available | |
| Donovan Ft | -- | None Available | |
| Donovan David S | $140,000 | -- | |
| Wyatt Roy D | $159,900 | -- |
Source: Public Records
Mortgage History
| Date | Status | Borrower | Loan Amount |
|---|---|---|---|
| Previous Owner | Wyatt Roy D | $200,000 | |
| Previous Owner | Wyatt Roy D | $220,000 | |
| Previous Owner | Wyatt Roy D | $200,000 |
Source: Public Records
Tax History Compared to Growth
Tax History
| Year | Tax Paid | Tax Assessment Tax Assessment Total Assessment is a certain percentage of the fair market value that is determined by local assessors to be the total taxable value of land and additions on the property. | Land | Improvement |
|---|---|---|---|---|
| 2025 | $5,513 | $545,800 | $207,900 | $337,900 |
| 2024 | $5,340 | $520,000 | $198,000 | $322,000 |
| 2023 | $5,153 | $493,100 | $183,400 | $309,700 |
| 2022 | $5,011 | $437,300 | $169,800 | $267,500 |
| 2021 | $4,621 | $393,600 | $169,800 | $223,800 |
| 2020 | $4,385 | $367,900 | $169,800 | $198,100 |
| 2019 | $4,278 | $353,000 | $163,200 | $189,800 |
| 2018 | $4,146 | $331,700 | $155,500 | $176,200 |
| 2017 | $3,969 | $309,800 | $148,100 | $161,700 |
| 2016 | $3,813 | $297,900 | $142,400 | $155,500 |
| 2015 | $3,666 | $284,200 | $142,400 | $141,800 |
| 2014 | $3,514 | $264,200 | $132,500 | $131,700 |
Source: Public Records
Map
Nearby Homes
- 116 Belmont St
- 501 Commerce Dr Unit 2310
- 501 Commerce Dr Unit 1111
- 501 Commerce Dr Unit 4206
- 501 Commerce Dr Unit 4308
- 501 Commerce Dr Unit 4306
- 200 Justin Dr Unit 3
- 655 Summer St
- 255 West St
- 262 West St
- 48 Apple Tree Ln
- 54 Federal St
- 67 Abby Rd
- 24 Blake Rd
- 432 Grove St
- 441 Grove St
- 92 Mercury St
- 972 Liberty St
- 2 Tara Dr Unit 1
- 33 Congress St