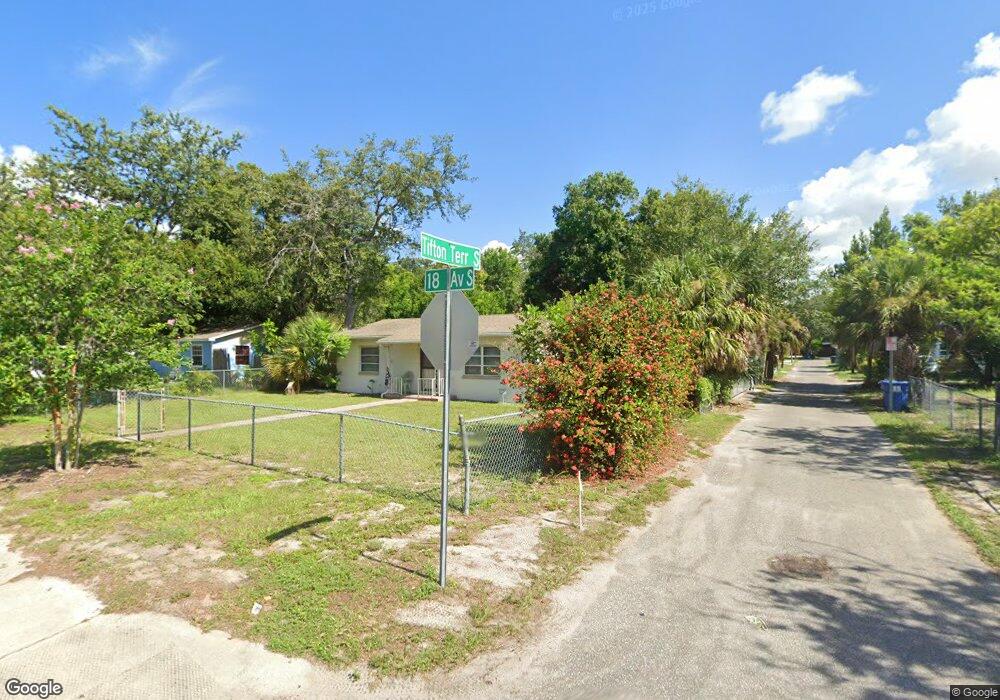
4651 18th Ave S Saint Petersburg, FL 33711
Childs Park NeighborhoodEstimated Value: $235,000 - $302,000
2
Beds
1
Bath
1,130
Sq Ft
$236/Sq Ft
Est. Value
About This Home
This home is located at 4651 18th Ave S, Saint Petersburg, FL 33711 and is currently estimated at $266,895, approximately $236 per square foot. 4651 18th Ave S is a home located in Pinellas County with nearby schools including Gulfport Montessori Elementary School, Azalea Middle School, and Boca Ciega High School.
Ownership History
Date
Name
Owned For
Owner Type
Purchase Details
Closed on
Mar 1, 2021
Sold by
Cincinnati Capital Partners 347 Llc
Bought by
Southside Capital Partners Llc
Current Estimated Value
Purchase Details
Closed on
May 28, 2020
Sold by
Southside Residential Llc
Bought by
Cincinnati Capital Partners 347 Llc
Purchase Details
Closed on
Jul 17, 2015
Sold by
Chicouris Peter
Bought by
Southside Residential Llc
Purchase Details
Closed on
Jun 25, 2010
Sold by
Pistol Investment Properties Llc
Bought by
Chicouris Peter
Purchase Details
Closed on
Jun 27, 2008
Sold by
Novastar Mortgage Inc
Bought by
Pistol Investment Properties Llc
Purchase Details
Closed on
Mar 4, 2008
Sold by
Dandridge Alphonso
Bought by
Novastar Mortgage Inc
Purchase Details
Closed on
Aug 14, 2002
Sold by
Dandridge Alphonso and Dandridge Debrareen
Bought by
Dandridge Alphonso
Create a Home Valuation Report for This Property
The Home Valuation Report is an in-depth analysis detailing your home's value as well as a comparison with similar homes in the area
Home Values in the Area
Average Home Value in this Area
Purchase History
| Date | Buyer | Sale Price | Title Company |
|---|---|---|---|
| Southside Capital Partners Llc | -- | Attorney | |
| Cincinnati Capital Partners 347 Llc | -- | Attorney | |
| Southside Residential Llc | $48,500 | Veritas Title Inc | |
| Chicouris Peter | -- | Veritas Title Inc | |
| Pistol Investment Properties Llc | $46,500 | Attorney | |
| Novastar Mortgage Inc | -- | Attorney | |
| Dandridge Alphonso | $11,000 | -- |
Source: Public Records
Mortgage History
| Date | Status | Borrower | Loan Amount |
|---|---|---|---|
| Previous Owner | Dandridge Alphonso | $113,400 | |
| Previous Owner | Dandridge Alphonso | $72,000 | |
| Previous Owner | Dandridge Alphonso | $18,000 |
Source: Public Records
Tax History Compared to Growth
Tax History
| Year | Tax Paid | Tax Assessment Tax Assessment Total Assessment is a certain percentage of the fair market value that is determined by local assessors to be the total taxable value of land and additions on the property. | Land | Improvement |
|---|---|---|---|---|
| 2024 | $3,359 | $184,968 | $69,136 | $115,832 |
| 2023 | $3,359 | $178,758 | $74,760 | $103,998 |
| 2022 | $3,006 | $150,065 | $78,500 | $71,565 |
| 2021 | $2,305 | $109,665 | $0 | $0 |
| 2020 | $1,420 | $79,662 | $0 | $0 |
| 2019 | $1,265 | $66,693 | $22,772 | $43,921 |
| 2018 | $1,211 | $68,326 | $0 | $0 |
| 2017 | $1,051 | $52,339 | $0 | $0 |
| 2016 | $925 | $41,450 | $0 | $0 |
| 2015 | $696 | $35,170 | $0 | $0 |
| 2014 | $586 | $25,618 | $0 | $0 |
Source: Public Records
Map
Nearby Homes
- 1773 Tifton Terrace S
- 4563 18th Ave S
- 4548 18th Ave S
- 4627 20th Ave S
- 4542 19th Ave S
- 1766 45th St S
- 1900 45th St S
- 1745 44th St S
- 1931 44th St S
- 4645 15th Ave S
- 4734 15th Ave S
- 5005 Tangerine Ave S
- 1340 46th St S
- 4300 18th Ave S
- 4701 14th Ave S
- 5105 Tangerine Ave S
- 2301 46th St S
- 4718 13th Ave S
- 4724 13th Ave S
- 4810 13th Ave S
- 4673 18th Ave S
- 4645 18th Ave S
- 1774 Temple Terrace S
- 1770 Tifton Terrace S
- 1766 Temple Terrace S
- 1760 Tifton Terrace S
- 4683 18th Ave S
- 1753 Tifton Terrace S
- 1773 Temple Terrace S
- 1760 Temple Terrace S
- 4631 18th Ave S
- 1754 Tifton Terrace S
- Temple Terrace S
- 1754 Temple Terrace S
- 4687 18th Ave S
- 4656 18th Ave S
- 1759 Temple Terrace S
- 4650 18th Ave S
- 4662 18th Ave S
- 4621 18th Ave S