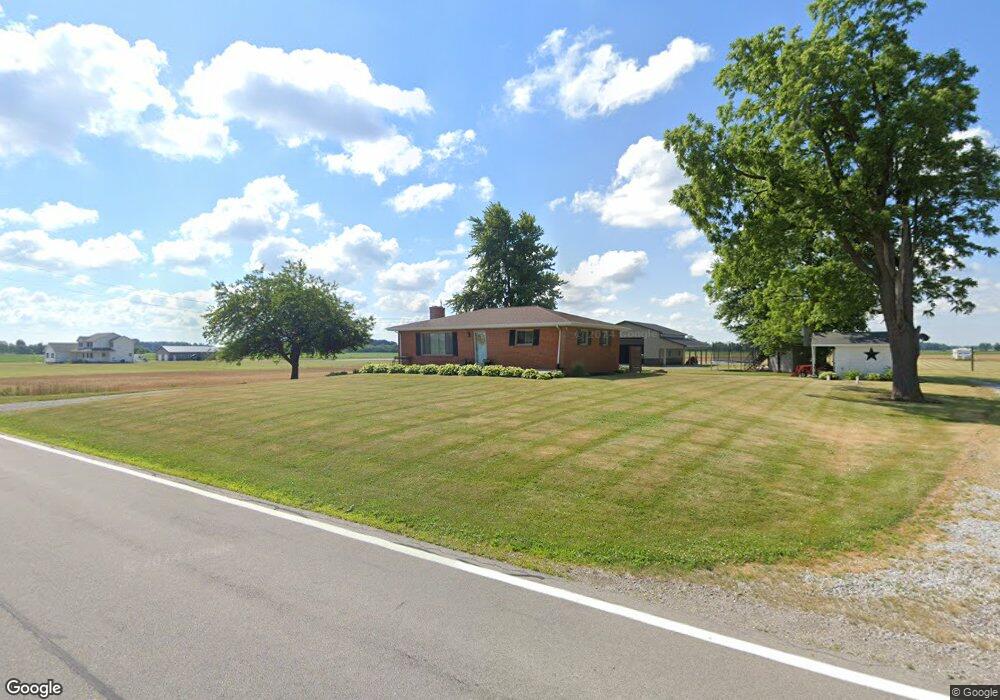
4651 State Route 120 Metamora, OH 43540
Estimated Value: $190,000 - $225,000
2
Beds
2
Baths
1,080
Sq Ft
$197/Sq Ft
Est. Value
About This Home
This home is located at 4651 State Route 120, Metamora, OH 43540 and is currently estimated at $212,303, approximately $196 per square foot. 4651 State Route 120 is a home located in Fulton County with nearby schools including Evergreen Elementary School, Evergreen Middle School, and Evergreen High School.
Ownership History
Date
Name
Owned For
Owner Type
Purchase Details
Closed on
Oct 17, 2014
Sold by
Haury Randy L
Bought by
Hesson Andrew K and Hesson Andrea N
Current Estimated Value
Home Financials for this Owner
Home Financials are based on the most recent Mortgage that was taken out on this home.
Original Mortgage
$110,000
Outstanding Balance
$84,269
Interest Rate
4.08%
Mortgage Type
Unknown
Estimated Equity
$128,034
Purchase Details
Closed on
Aug 21, 2012
Sold by
Haury Randy L and Haury Beth A
Bought by
Haury Randy L
Purchase Details
Closed on
Dec 23, 2009
Sold by
Koester Phyllis and Koester Frank
Bought by
Haury Randy and Haury Beth
Purchase Details
Closed on
Sep 5, 2000
Sold by
Fike Margery
Bought by
Havre Randy and Havre Beth
Purchase Details
Closed on
Jan 1, 1990
Bought by
Fike Margery R
Create a Home Valuation Report for This Property
The Home Valuation Report is an in-depth analysis detailing your home's value as well as a comparison with similar homes in the area
Home Values in the Area
Average Home Value in this Area
Purchase History
| Date | Buyer | Sale Price | Title Company |
|---|---|---|---|
| Hesson Andrew K | $125,000 | Greater Metropolitan Title | |
| Haury Randy L | -- | None Available | |
| Haury Randy | -- | Attorney | |
| Havre Randy | $105,000 | -- | |
| Fike Margery R | -- | -- |
Source: Public Records
Mortgage History
| Date | Status | Borrower | Loan Amount |
|---|---|---|---|
| Open | Hesson Andrew K | $110,000 |
Source: Public Records
Tax History Compared to Growth
Tax History
| Year | Tax Paid | Tax Assessment Tax Assessment Total Assessment is a certain percentage of the fair market value that is determined by local assessors to be the total taxable value of land and additions on the property. | Land | Improvement |
|---|---|---|---|---|
| 2024 | $2,096 | $57,790 | $13,200 | $44,590 |
| 2023 | $2,114 | $57,790 | $13,200 | $44,590 |
| 2022 | $2,011 | $45,290 | $10,990 | $34,300 |
| 2021 | $1,970 | $45,290 | $10,990 | $34,300 |
| 2020 | $1,947 | $45,290 | $10,990 | $34,300 |
| 2019 | $1,573 | $37,210 | $9,940 | $27,270 |
| 2018 | $1,492 | $37,210 | $9,940 | $27,270 |
| 2017 | $1,474 | $37,210 | $9,940 | $27,270 |
| 2016 | $1,457 | $34,930 | $9,940 | $24,990 |
| 2015 | $1,377 | $34,930 | $9,940 | $24,990 |
| 2014 | $1,386 | $34,930 | $9,940 | $24,990 |
| 2013 | $1,376 | $32,520 | $9,700 | $22,820 |
Source: Public Records
Map
Nearby Homes
- 13614 Hodges Hwy
- 5120 US Highway 20
- 2674 US Highway 20
- 11057 Arnold Hwy
- 7 359 County Road Rd W
- 5905 Ohio St
- 13001 Central Ave
- 1400 N Fulton Lucas Rd
- 1102 N Fulton Lucas Rd
- 3893 County Road L
- 2261 W Yankee Rd
- 2716 County Road L
- 510 N Adrian St
- 508 N Adrian St
- 11883 Sylvania-Metamora Rd
- 313 S Adrian St
- 8667 Thompson Hwy
- 313 W Morenci St
- 3099 W Yankee Rd
- 7127 Scott Hwy
- 4633 State Route 120
- 4672 State Route 120
- 4618 State Route 120
- 4618 Ohio 120
- 4505 State Route 120
- 4800 Sh 120
- 4800 State Route 120
- 4800 Ohio 120
- 4833 State Route 120
- 4267 State Route 120
- 17050 County Road 5
- 5051 State Route 120
- 17090 County Road 5
- 16551 Co Rd 4-1
- 4198 State Route 120
- 4170 State Route 120
- 4170 State Route 120
- 4136 State Route 120
- 5136 State Route 120
- 5165 State Route 120