Estimated Value: $365,000 - $462,411
4
Beds
3
Baths
2,161
Sq Ft
$186/Sq Ft
Est. Value
About This Home
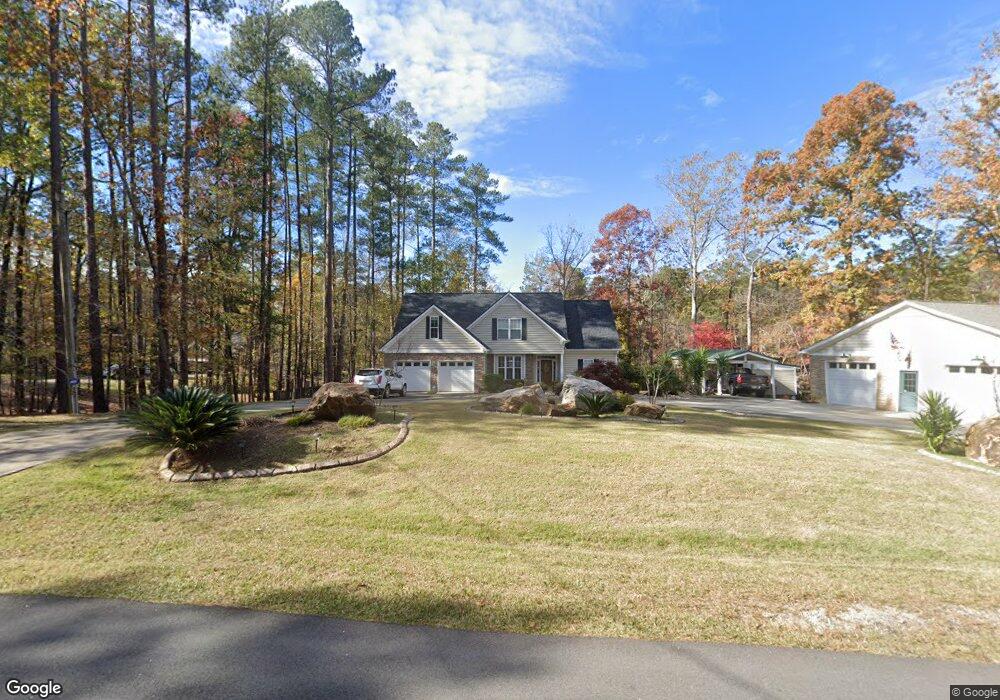
This home is located at 4652 Hickory Dr, Evans, GA 30809 and is currently estimated at $401,103, approximately $185 per square foot. 4652 Hickory Dr is a home located in Columbia County with nearby schools including Westmont Elementary School, Evans Middle School, and Evans High School.
Ownership History
Date
Name
Owned For
Owner Type
Purchase Details
Closed on
Mar 1, 2006
Sold by
Gorman Andrew I
Bought by
Cockrell Danny L
Current Estimated Value
Home Financials for this Owner
Home Financials are based on the most recent Mortgage that was taken out on this home.
Original Mortgage
$207,120
Outstanding Balance
$114,523
Interest Rate
6.19%
Mortgage Type
New Conventional
Estimated Equity
$286,580
Purchase Details
Closed on
Sep 10, 2003
Sold by
Patterson J Scott
Bought by
Gorman Andrew S and Oberlander Margot Richenda
Home Financials for this Owner
Home Financials are based on the most recent Mortgage that was taken out on this home.
Original Mortgage
$195,387
Interest Rate
6.24%
Mortgage Type
Purchase Money Mortgage
Purchase Details
Closed on
Apr 1, 2003
Sold by
Carter Charles E and Carter C
Bought by
Patterson J Scott and Patterson & Construction
Home Financials for this Owner
Home Financials are based on the most recent Mortgage that was taken out on this home.
Original Mortgage
$136,500
Interest Rate
5.62%
Mortgage Type
Construction
Create a Home Valuation Report for This Property
The Home Valuation Report is an in-depth analysis detailing your home's value as well as a comparison with similar homes in the area
Home Values in the Area
Average Home Value in this Area
Purchase History
| Date | Buyer | Sale Price | Title Company |
|---|---|---|---|
| Cockrell Danny L | $258,900 | -- | |
| Cockrell Danny L | $258,900 | -- | |
| Cockrell Danny L | $258,900 | -- | |
| Gorman Andrew S | $192,500 | -- | |
| Patterson J Scott | $35,000 | -- |
Source: Public Records
Mortgage History
| Date | Status | Borrower | Loan Amount |
|---|---|---|---|
| Open | Cockrell Danny L | $207,120 | |
| Closed | Cockrell Danny L | $207,120 | |
| Previous Owner | Gorman Andrew S | $195,387 | |
| Previous Owner | Patterson J Scott | $136,500 |
Source: Public Records
Tax History
| Year | Tax Paid | Tax Assessment Tax Assessment Total Assessment is a certain percentage of the fair market value that is determined by local assessors to be the total taxable value of land and additions on the property. | Land | Improvement |
|---|---|---|---|---|
| 2025 | $1,282 | $170,512 | $49,414 | $121,098 |
| 2024 | $1,261 | $162,115 | $49,414 | $112,701 |
| 2023 | $1,261 | $153,796 | $42,726 | $111,070 |
| 2022 | $1,208 | $140,901 | $34,822 | $106,079 |
| 2021 | $1,157 | $128,274 | $34,822 | $93,452 |
| 2020 | $3,386 | $123,972 | $34,038 | $89,934 |
| 2019 | $3,322 | $121,674 | $34,038 | $87,636 |
| 2018 | $3,296 | $120,290 | $34,038 | $86,252 |
| 2017 | $3,318 | $120,687 | $35,756 | $84,931 |
| 2016 | $3,268 | $123,295 | $35,721 | $87,574 |
| 2015 | $3,307 | $124,517 | $35,721 | $88,796 |
| 2014 | $2,927 | $109,107 | $35,721 | $73,386 |
Source: Public Records
Map
Nearby Homes
- 4558 Glenda Ln
- 4535 Glenda Ln
- 4621 Durbin Dr
- 4613 Durbin Dr
- 4517 Glennwood Dr
- 409 Constitution Ave
- 213 N Belair Rd
- 4777 Cold Springs Dr
- 00 N Rd
- 4442 Roxbury Dr
- 4724 Canterbury Ln
- 245 Belair Rd N
- 4755 Maple Spring Ct
- 4009 Waccamaw Dr
- 2110 Oak Ridge Rd
- 4469 Misty Cove Ct
- 3114 Wayne Dr
- 3192 Wayne Dr
- 902 Lillian Park Dr Unit Lp111
- 4441 Shadowmoor Dr
- 4650 Hickory Dr
- 4648 Hickory Dr
- 4625 Hickory Dr
- 4644 Hickory Dr
- 4627 Hickory Dr
- 4656 Hickory Dr
- 4629 Hickory Dr
- 4656 Hickory Dr
- 4615 Hickory Dr
- 4613 Hickory Dr
- 4646 Hickory Dr
- 4611 Hickory Dr
- 4662 Hickory Dr
- 4660 Hickory Dr
- 4620 Hickory Dr
- 4607 Hickory Dr
- 4618 Hickory Dr
- 235 Calloway Dr
- 245 Hickory Ct
- 4606 Hickory Dr
Your Personal Tour Guide
Ask me questions while you tour the home.