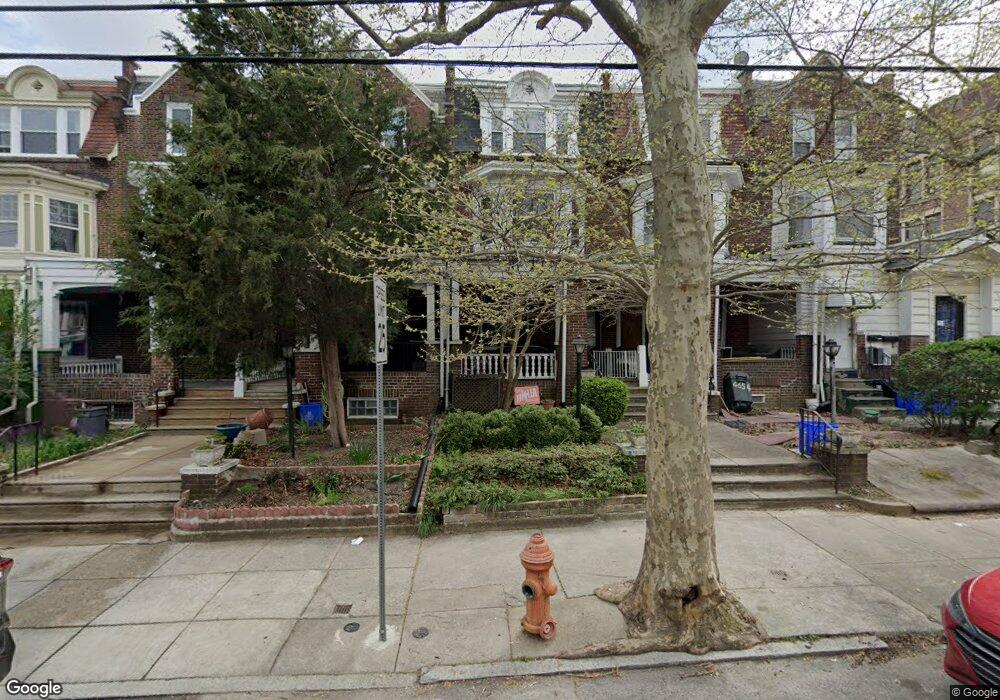
4652 Locust St Philadelphia, PA 19139
Garden Court NeighborhoodEstimated Value: $473,000 - $726,000
4
Beds
2
Baths
2,720
Sq Ft
$240/Sq Ft
Est. Value
About This Home
This home is located at 4652 Locust St, Philadelphia, PA 19139 and is currently estimated at $652,700, approximately $239 per square foot. 4652 Locust St is a home located in Philadelphia County with nearby schools including Henry C. Lea School, West Philadelphia High School, and KIPP Philadelphia Octavius Catto CS.
Ownership History
Date
Name
Owned For
Owner Type
Purchase Details
Closed on
Mar 14, 2011
Sold by
Us Bank National Association
Bought by
Kaspin Rachelle J
Current Estimated Value
Home Financials for this Owner
Home Financials are based on the most recent Mortgage that was taken out on this home.
Original Mortgage
$179,200
Outstanding Balance
$122,506
Interest Rate
4.76%
Mortgage Type
New Conventional
Estimated Equity
$530,194
Purchase Details
Closed on
Dec 13, 2010
Sold by
Hardy Charles J
Bought by
U S Bank National Association
Purchase Details
Closed on
Dec 27, 1999
Sold by
Federal National Mortgage Association
Bought by
Hardy Charles J
Home Financials for this Owner
Home Financials are based on the most recent Mortgage that was taken out on this home.
Original Mortgage
$45,675
Interest Rate
7.71%
Purchase Details
Closed on
May 4, 1999
Sold by
Hull Wavey
Bought by
Federal National Mortgage Association
Purchase Details
Closed on
Nov 22, 1994
Sold by
Federal National Mortgage Association
Bought by
Hull Wavey S
Purchase Details
Closed on
Jul 11, 1994
Sold by
Green John D
Bought by
Federal National Mortgage Association
Create a Home Valuation Report for This Property
The Home Valuation Report is an in-depth analysis detailing your home's value as well as a comparison with similar homes in the area
Home Values in the Area
Average Home Value in this Area
Purchase History
| Date | Buyer | Sale Price | Title Company |
|---|---|---|---|
| Kaspin Rachelle J | $224,000 | Land Title Services | |
| U S Bank National Association | $7,100 | None Available | |
| Hardy Charles J | $43,500 | -- | |
| Federal National Mortgage Association | $6,600 | -- | |
| Hull Wavey S | $35,000 | -- | |
| Federal National Mortgage Association | $4,100 | -- |
Source: Public Records
Mortgage History
| Date | Status | Borrower | Loan Amount |
|---|---|---|---|
| Open | Kaspin Rachelle J | $179,200 | |
| Previous Owner | Hardy Charles J | $45,675 |
Source: Public Records
Tax History Compared to Growth
Tax History
| Year | Tax Paid | Tax Assessment Tax Assessment Total Assessment is a certain percentage of the fair market value that is determined by local assessors to be the total taxable value of land and additions on the property. | Land | Improvement |
|---|---|---|---|---|
| 2026 | $8,691 | $562,200 | $112,440 | $449,760 |
| 2025 | $8,691 | $562,200 | $112,440 | $449,760 |
| 2024 | $8,691 | $730,500 | $146,100 | $584,400 |
| 2023 | $8,691 | $620,900 | $124,180 | $496,720 |
| 2022 | $4,422 | $575,900 | $124,180 | $451,720 |
| 2021 | $5,052 | $0 | $0 | $0 |
| 2020 | $5,052 | $0 | $0 | $0 |
| 2019 | $4,863 | $0 | $0 | $0 |
| 2018 | $4,318 | $0 | $0 | $0 |
| 2017 | $4,318 | $0 | $0 | $0 |
| 2016 | $3,898 | $0 | $0 | $0 |
| 2015 | $5,211 | $0 | $0 | $0 |
| 2014 | -- | $418,900 | $79,514 | $339,386 |
| 2012 | -- | $22,560 | $4,636 | $17,924 |
Source: Public Records
Map
Nearby Homes
- 4622 Locust St
- 4620 Locust St
- 251 S 46th St
- 257 S 46th St
- 4727 00 Walnut St Unit 4
- 4637 Pine St Unit D410
- 4637 Pine St Unit D311
- 400-02 S 47th St
- 124 S 46th St
- 122 S 46th St
- 238 S 45th St
- 120 S 46th St
- 230 S 45th St
- 236 S 45th St
- 4542 Sansom St
- 118 S 46th St
- 218 S 45th St
- 4530 Sansom St
- 233 S 45th St
- 4525 Sansom St
- 4650 Locust St
- 4654 Locust St
- 4648 Locust St
- 4656 Locust St
- 4646 Locust St
- 237 S 47th St Unit 5A
- 237 S 47th St Unit 17D
- 4646R Locust St
- 4640 Locust St
- 4644 Locust St
- 4638 Locust St
- 241 S 47th St
- 4636 Locust St
- 4634 Locust St
- 4657 Locust St
- 4655 Locust St
- 4653 Locust St
- 246 S Farragut St
- 4651 Locust St
- 4659 Locust St