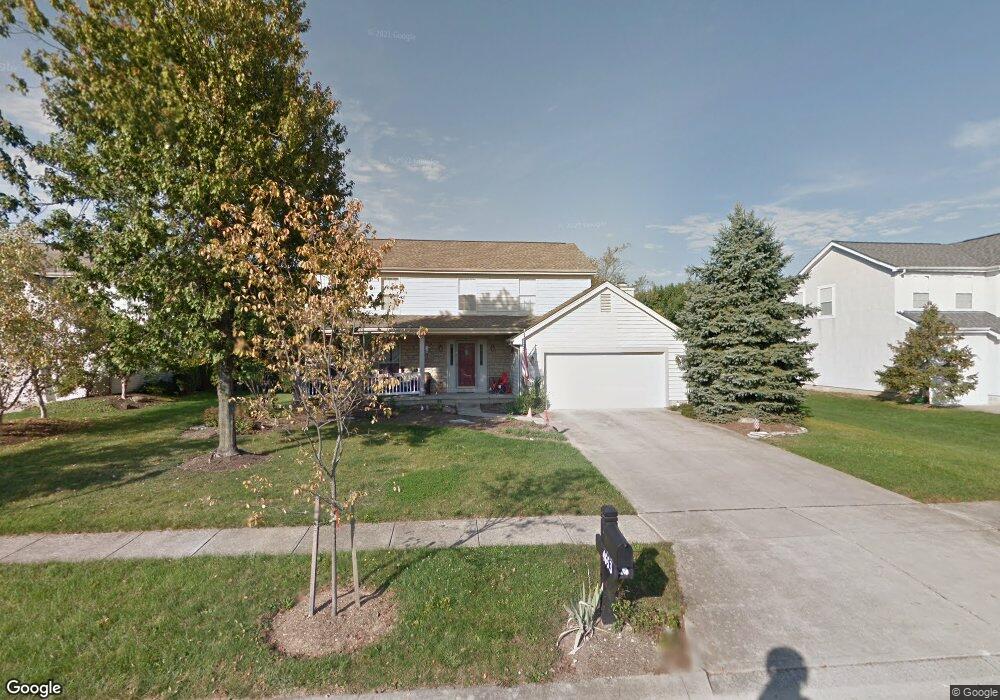
4653 Clayburn Ct Grove City, OH 43123
Estimated Value: $409,000 - $431,000
4
Beds
3
Baths
2,159
Sq Ft
$194/Sq Ft
Est. Value
About This Home
This home is located at 4653 Clayburn Ct, Grove City, OH 43123 and is currently estimated at $418,031, approximately $193 per square foot. 4653 Clayburn Ct is a home located in Franklin County with nearby schools including Hayes Intermediate School, Jc Sommer Elementary School, and Jackson Middle School.
Ownership History
Date
Name
Owned For
Owner Type
Purchase Details
Closed on
Feb 5, 2020
Sold by
Chaffin Erin P
Bought by
Chaffin Erin P and Erin P Chaffin Trust
Current Estimated Value
Purchase Details
Closed on
Jan 28, 2020
Sold by
Estate Of Harvey G Chaffin Jr
Bought by
Chaffin Erin P
Purchase Details
Closed on
Aug 22, 2013
Sold by
Arnold Mary J and Jpmorgan Chase Bank Na
Bought by
Chaffin Harvey and Chaffin Erin
Home Financials for this Owner
Home Financials are based on the most recent Mortgage that was taken out on this home.
Original Mortgage
$140,000
Outstanding Balance
$104,692
Interest Rate
4.53%
Mortgage Type
New Conventional
Estimated Equity
$313,339
Purchase Details
Closed on
Sep 24, 1999
Sold by
Bapst James G and Bapst Nancy A
Bought by
Arnold Mary J
Home Financials for this Owner
Home Financials are based on the most recent Mortgage that was taken out on this home.
Original Mortgage
$150,000
Interest Rate
7.93%
Purchase Details
Closed on
Jan 5, 1994
Bought by
Bapst James G and Bapst Nancy A
Purchase Details
Closed on
Apr 27, 1993
Create a Home Valuation Report for This Property
The Home Valuation Report is an in-depth analysis detailing your home's value as well as a comparison with similar homes in the area
Home Values in the Area
Average Home Value in this Area
Purchase History
| Date | Buyer | Sale Price | Title Company |
|---|---|---|---|
| Chaffin Erin P | -- | None Available | |
| Chaffin Erin P | -- | None Available | |
| Chaffin Harvey | $175,000 | None Available | |
| Arnold Mary J | $187,500 | Chicago Title | |
| Bapst James G | $146,800 | -- | |
| -- | $50,500 | -- |
Source: Public Records
Mortgage History
| Date | Status | Borrower | Loan Amount |
|---|---|---|---|
| Open | Chaffin Harvey | $140,000 | |
| Previous Owner | Arnold Mary J | $150,000 |
Source: Public Records
Tax History Compared to Growth
Tax History
| Year | Tax Paid | Tax Assessment Tax Assessment Total Assessment is a certain percentage of the fair market value that is determined by local assessors to be the total taxable value of land and additions on the property. | Land | Improvement |
|---|---|---|---|---|
| 2024 | $5,655 | $124,360 | $39,870 | $84,490 |
| 2023 | $5,575 | $124,355 | $39,865 | $84,490 |
| 2022 | $5,727 | $93,910 | $20,340 | $73,570 |
| 2021 | $5,837 | $93,910 | $20,340 | $73,570 |
| 2020 | $5,819 | $93,910 | $20,340 | $73,570 |
| 2019 | $5,229 | $78,300 | $16,940 | $61,360 |
| 2018 | $5,194 | $78,300 | $16,940 | $61,360 |
| 2017 | $5,191 | $78,300 | $16,940 | $61,360 |
| 2016 | $5,176 | $71,410 | $15,860 | $55,550 |
| 2015 | $5,177 | $71,410 | $15,860 | $55,550 |
| 2014 | $5,181 | $71,410 | $15,860 | $55,550 |
| 2013 | $4,655 | $67,970 | $15,085 | $52,885 |
Source: Public Records
Map
Nearby Homes
- 2651 Hoover Crossing Way
- 2618 Vililly Cir W
- 4754 Glencross Ct
- 2642 Gardenview Loop
- 2750 Longridge Way
- 2624 Gardenview Loop
- 4881 Primrose Ct
- 2720 Loris Way
- 4879 Blossom Way Unit 41
- 3022 Crabapple Place Unit 4
- 2873 Woodgrove Dr
- 5124 Keefer Ln
- 5148 Keefer Ln
- 0 Hoover Rd
- 2690 Eugene Ave
- 2634 Orders Road Ct
- 4318 Maplegrove Dr
- 4838 Adwell Loop
- 4521 Haughn Rd
- 3171 Orders Rd
- 4663 Clayburn Ct
- 4643 Clayburn Ct
- 4605 Clayburn Ct
- 4518 Clayburn Dr W
- 4538 Clayburn Dr W
- 4508 Clayburn Dr W
- 4673 Clayburn Ct
- 4654 Clayburn Ct
- 4605 Clayburn Dr E
- 4664 Clayburn Ct
- 4683 Clayburn Ct
- 4578 Clayburn Dr W
- 4568 Clayburn Dr W
- 4568 Clayburn Dr W
- 4674 Clayburn Ct
- 4588 Clayburn Dr W
- 4488 Clayburn Dr W
- 4625 Clayburn Dr E
- 4598 Clayburn Dr W
- 4568 Clayburn Dr E