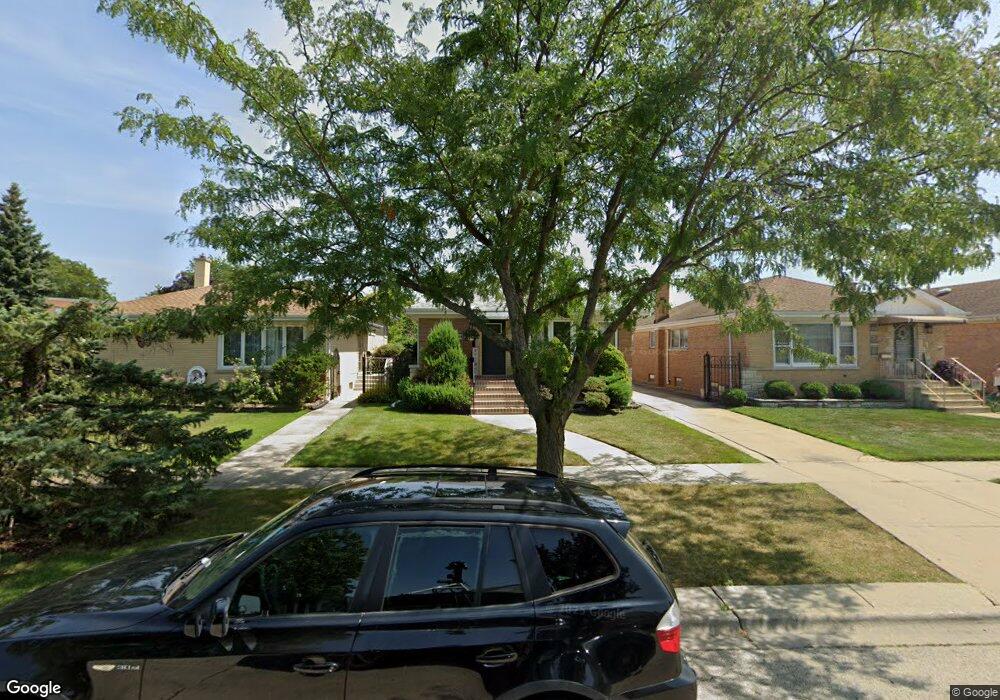
4653 N Osage Ave Norridge, IL 60706
Estimated Value: $456,631 - $578,000
3
Beds
2
Baths
1,723
Sq Ft
$299/Sq Ft
Est. Value
About This Home
This home is located at 4653 N Osage Ave, Norridge, IL 60706 and is currently estimated at $515,158, approximately $298 per square foot. 4653 N Osage Ave is a home located in Cook County with nearby schools including J Leigh Elementary School, Ridgewood Community High School, and St Eugene School.
Ownership History
Date
Name
Owned For
Owner Type
Purchase Details
Closed on
May 26, 2005
Sold by
Dibenedetto Virgilio and Dibenedetto Angelo
Bought by
Kenny David and Kenny Deirdre
Current Estimated Value
Home Financials for this Owner
Home Financials are based on the most recent Mortgage that was taken out on this home.
Original Mortgage
$205,000
Outstanding Balance
$107,435
Interest Rate
5.82%
Mortgage Type
Fannie Mae Freddie Mac
Estimated Equity
$407,723
Purchase Details
Closed on
Dec 10, 1997
Sold by
Dibenedetto Virgilio and Dibenedetto Angela
Bought by
Dibenedetto Virgilio and Dibenedetto Angela
Home Financials for this Owner
Home Financials are based on the most recent Mortgage that was taken out on this home.
Original Mortgage
$93,000
Interest Rate
7.35%
Purchase Details
Closed on
Jan 21, 1991
Sold by
Dibenedetto Virgilio and Dibenedetto Angela
Bought by
Dibenedetto Virgilio and Dibenedetto Angela
Create a Home Valuation Report for This Property
The Home Valuation Report is an in-depth analysis detailing your home's value as well as a comparison with similar homes in the area
Home Values in the Area
Average Home Value in this Area
Purchase History
| Date | Buyer | Sale Price | Title Company |
|---|---|---|---|
| Kenny David | $465,000 | Cti | |
| Dibenedetto Virgilio | -- | Attorneys Natl Title Network | |
| Dibenedetto Virgilio | -- | -- |
Source: Public Records
Mortgage History
| Date | Status | Borrower | Loan Amount |
|---|---|---|---|
| Open | Kenny David | $205,000 | |
| Previous Owner | Dibenedetto Virgilio | $93,000 |
Source: Public Records
Tax History Compared to Growth
Tax History
| Year | Tax Paid | Tax Assessment Tax Assessment Total Assessment is a certain percentage of the fair market value that is determined by local assessors to be the total taxable value of land and additions on the property. | Land | Improvement |
|---|---|---|---|---|
| 2024 | $8,223 | $39,000 | $6,968 | $32,032 |
| 2023 | $7,995 | $39,000 | $6,968 | $32,032 |
| 2022 | $7,995 | $39,000 | $6,968 | $32,032 |
| 2021 | $6,744 | $29,845 | $6,164 | $23,681 |
| 2020 | $6,630 | $29,845 | $6,164 | $23,681 |
| 2019 | $6,610 | $33,496 | $6,164 | $27,332 |
| 2018 | $6,352 | $28,305 | $5,092 | $23,213 |
| 2017 | $6,211 | $28,305 | $5,092 | $23,213 |
| 2016 | $6,060 | $28,305 | $5,092 | $23,213 |
| 2015 | $6,084 | $26,513 | $4,422 | $22,091 |
| 2014 | $6,007 | $26,513 | $4,422 | $22,091 |
| 2013 | $5,870 | $26,513 | $4,422 | $22,091 |
Source: Public Records
Map
Nearby Homes
- 4617 N Canfield Ave
- 4621 N Ozanam Ave
- 8025 W Giddings St
- 4436 N Osage Ave
- 4404 N Opal Ave
- 7650 W Lawrence Ave Unit 201
- 8200 W Eastwood Ave
- 4846 N Crescent Ave
- 4937 N Ozanam Ave
- 7616 W Lawrence Ave Unit 3A
- 7641 W Ainslie St
- 7604 W Lawrence Ave Unit 1B
- 4338 N Overhill Ave
- 7632 W Norridge St
- 8268 W Lawrence Ave
- 5134 N Mission Dr
- 7636 W Strong St
- 8024 W Charmaine Rd
- 8255 W Agatite Ave
- 5161 N Moreland Ave
- 4649 N Osage Ave
- 4657 N Osage Ave
- 4645 N Osage Ave
- 4641 N Osage Ave
- 4652 N Orange Ave
- 4648 N Orange Ave
- 4656 N Orange Ave
- 4644 N Orange Ave
- 4637 N Osage Ave
- 4640 N Orange Ave
- 4652 N Osage Ave
- 4656 N Osage Ave
- 4633 N Osage Ave
- 4648 N Osage Ave
- 4636 N Orange Ave
- 4644 N Osage Ave
- 4640 N Osage Ave
- 4632 N Orange Ave
- 4629 N Osage Ave
- 4636 N Osage Ave