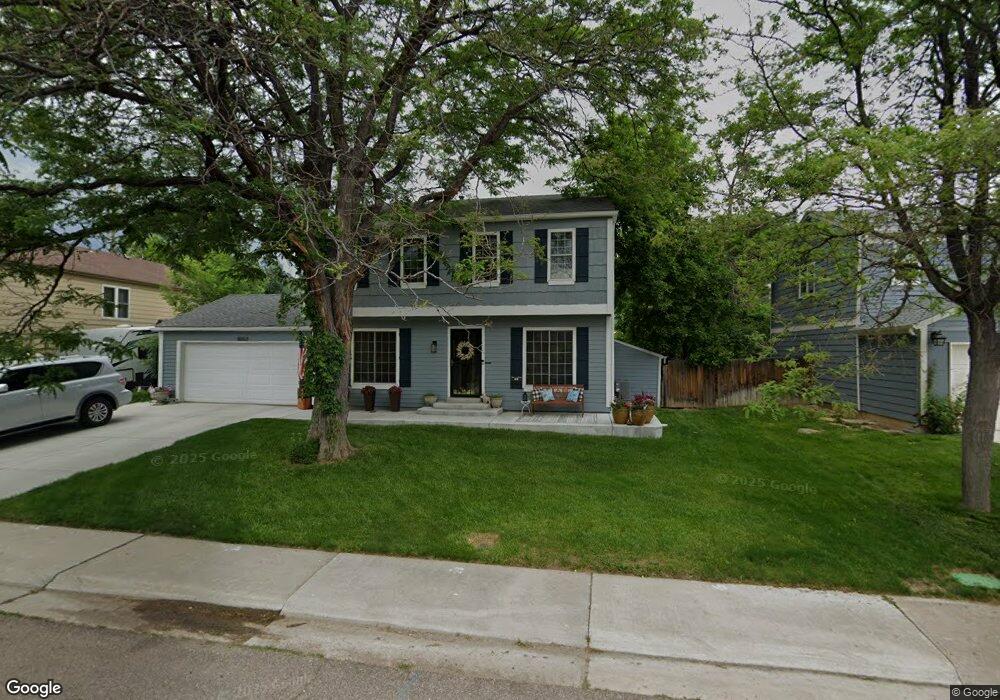
4653 S Vivian Ct Morrison, CO 80465
Friendly Hills NeighborhoodEstimated Value: $590,511 - $623,000
4
Beds
5
Baths
1,740
Sq Ft
$345/Sq Ft
Est. Value
About This Home
This home is located at 4653 S Vivian Ct, Morrison, CO 80465 and is currently estimated at $599,878, approximately $344 per square foot. 4653 S Vivian Ct is a home located in Jefferson County with nearby schools including Kendallvue Elementary School, Carmody Middle School, and Bear Creek High School.
Create a Home Valuation Report for This Property
The Home Valuation Report is an in-depth analysis detailing your home's value as well as a comparison with similar homes in the area
Home Values in the Area
Average Home Value in this Area
Tax History Compared to Growth
Tax History
| Year | Tax Paid | Tax Assessment Tax Assessment Total Assessment is a certain percentage of the fair market value that is determined by local assessors to be the total taxable value of land and additions on the property. | Land | Improvement |
|---|---|---|---|---|
| 2024 | $3,239 | $33,074 | $9,927 | $23,147 |
| 2023 | $3,239 | $33,074 | $9,927 | $23,147 |
| 2022 | $2,912 | $29,195 | $8,190 | $21,005 |
| 2021 | $2,949 | $30,034 | $8,425 | $21,609 |
| 2020 | $2,599 | $26,528 | $6,701 | $19,827 |
| 2019 | $2,567 | $26,528 | $6,701 | $19,827 |
| 2018 | $2,352 | $23,477 | $6,327 | $17,150 |
| 2017 | $2,147 | $23,477 | $6,327 | $17,150 |
| 2016 | $1,860 | $19,625 | $4,955 | $14,670 |
| 2015 | $1,603 | $19,625 | $4,955 | $14,670 |
| 2014 | $1,603 | $15,865 | $4,594 | $11,271 |
Source: Public Records
Map
Nearby Homes
- 12234 W Saratoga Ave
- 4726 S Taft St
- 11891 W Stanford Place
- 4688 S Swadley Way
- 4921 S Wright Ct
- 13018 W Marlowe Ave
- 4816 S Zang Way
- 4416 S Vivian St
- 4420 S Vivian Way
- 12593 W Grand Dr
- 4570 S Swadley Ct
- 11705 W Stanford Ln
- 11766 W Radcliff Ave
- 11200 W Tanforan Cir
- 4544 S Routt St
- 11661 W Quincy Place
- 11796 W Belleview Dr
- 5046 S Robb St
- 12196 W Belleview Dr
- 5013 S Queen Ct
- 4663 S Vivian Ct
- 12364 W Tufts Ave
- 12394 W Tufts Ave
- 4633 S Vivian Ct
- 12334 W Tufts Ave
- 4652 S Vivian Ct
- 4673 S Vivian Ct
- 4672 S Vivian Ct
- 12414 W Tufts Ave
- 4642 S Vivian Ct
- 12294 W Tufts Ave
- 4623 S Vivian Ct
- 4683 S Vivian Ct
- 4608 S Ward Way
- 4682 S Vivian Ct
- 4632 S Vivian Ct
- 4671 S Vivian St
- 4618 S Ward Way
- 12373 W Tufts Ave
- 4661 S Vivian St