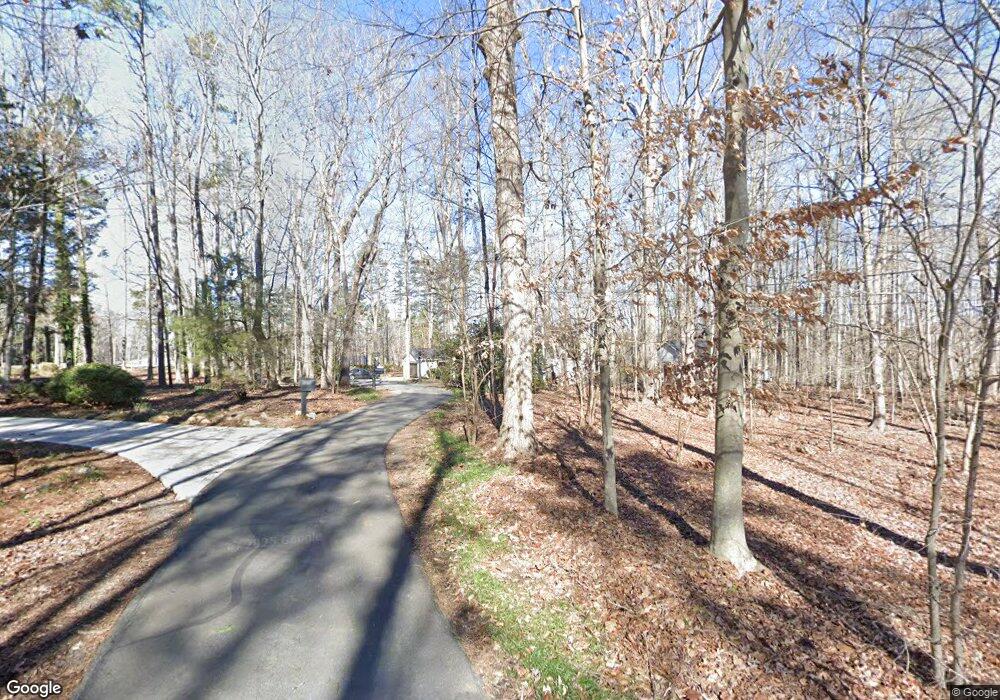
4655 Matthews Mint Hill Rd Matthews, NC 28105
Estimated Value: $956,000 - $1,331,000
5
Beds
4
Baths
4,603
Sq Ft
$237/Sq Ft
Est. Value
About This Home
This home is located at 4655 Matthews Mint Hill Rd, Matthews, NC 28105 and is currently estimated at $1,090,788, approximately $236 per square foot. 4655 Matthews Mint Hill Rd is a home located in Mecklenburg County with nearby schools including Northeast Middle, Independence High, and Queen's Grant Community School.
Ownership History
Date
Name
Owned For
Owner Type
Purchase Details
Closed on
Nov 25, 2019
Sold by
Newpath Properties Inc
Bought by
Johnson Jeffery C and Johnson Alicia L
Current Estimated Value
Purchase Details
Closed on
Dec 29, 2017
Sold by
Johnson Jeffrey and Johnson Alicia
Bought by
Newpath Properties Inc
Home Financials for this Owner
Home Financials are based on the most recent Mortgage that was taken out on this home.
Original Mortgage
$497,250
Interest Rate
3.5%
Mortgage Type
Adjustable Rate Mortgage/ARM
Purchase Details
Closed on
Dec 22, 2017
Sold by
New Path Properti8es Inc
Bought by
Johnson Jeffrey and Johnson Alicia
Home Financials for this Owner
Home Financials are based on the most recent Mortgage that was taken out on this home.
Original Mortgage
$497,250
Interest Rate
3.5%
Mortgage Type
Adjustable Rate Mortgage/ARM
Purchase Details
Closed on
Jan 1, 1975
Bought by
Nelson Nelson H and Nelson Marionrebecca
Create a Home Valuation Report for This Property
The Home Valuation Report is an in-depth analysis detailing your home's value as well as a comparison with similar homes in the area
Home Values in the Area
Average Home Value in this Area
Purchase History
| Date | Buyer | Sale Price | Title Company |
|---|---|---|---|
| Johnson Jeffery C | -- | None Available | |
| Newpath Properties Inc | -- | None Available | |
| Johnson Jeffrey | -- | None Available | |
| Nelson Nelson H | -- | -- |
Source: Public Records
Mortgage History
| Date | Status | Borrower | Loan Amount |
|---|---|---|---|
| Previous Owner | Johnson Jeffrey | $497,250 |
Source: Public Records
Tax History Compared to Growth
Tax History
| Year | Tax Paid | Tax Assessment Tax Assessment Total Assessment is a certain percentage of the fair market value that is determined by local assessors to be the total taxable value of land and additions on the property. | Land | Improvement |
|---|---|---|---|---|
| 2025 | $6,971 | $977,500 | $135,000 | $842,500 |
| 2024 | $6,971 | $977,500 | $135,000 | $842,500 |
| 2023 | $6,297 | $895,600 | $135,000 | $760,600 |
| 2022 | $3,743 | $424,800 | $90,000 | $334,800 |
| 2021 | $3,743 | $424,800 | $90,000 | $334,800 |
| 2020 | $3,704 | $424,800 | $90,000 | $334,800 |
| 2019 | $3,737 | $424,800 | $90,000 | $334,800 |
| 2018 | $4,159 | $341,900 | $74,500 | $267,400 |
| 2017 | $3,736 | $341,900 | $74,500 | $267,400 |
| 2016 | $3,733 | $341,900 | $74,500 | $267,400 |
| 2015 | $3,729 | $341,900 | $74,500 | $267,400 |
| 2014 | $4,181 | $383,700 | $116,300 | $267,400 |
Source: Public Records
Map
Nearby Homes
- 11632 Barnard St
- 4500 Matthews Mint Hill Rd
- 5344 Saddlewood Ln
- 11401 Home Place Ln
- 5918 Foxcrest Dr
- 12705 Twilight Dr
- 5828 Foxcrest Dr
- 3985 Well Rd
- 5240 Birchhill Rd
- 4008 Leyland Ct
- 6525 Robin Hollow Dr
- 5900 Oakwielde Ct
- 12515 Hashanli Place
- 6001 Gold Wagon Ln
- 3824 Matthews Mint Hill Rd
- 7301 Timber Ridge Dr
- 11215 Idlewild Rd
- 20417 Creek Bend Edge Ct
- 13828 Lake Bluff Dr
- 10437 Idlewild Rd
- 4659 Matthews Mint Hill Rd
- 4649 Matthews Mint Hill Rd
- 4416 Birdie Ct
- 4415 Birdie Ct
- 4921 Golfview Ct
- 4418 Walter Nelson Rd
- 4932 Magglucci Place
- 4408 Birdie Ct
- 4407 Birdie Ct
- 4645 Matthews Mint Hill Rd
- 4928 Magglucci Place
- 4641 Matthews Mint Hill Rd
- 4919 Golfview Ct
- 4922 Magglucci Place
- 4410 Walter Nelson Rd
- 4336 Birdie Ct
- 4420 Walter Nelson Rd
- 4936 Magglucci Place
- 4335 Birdie Ct
- 4917 Golfview Ct