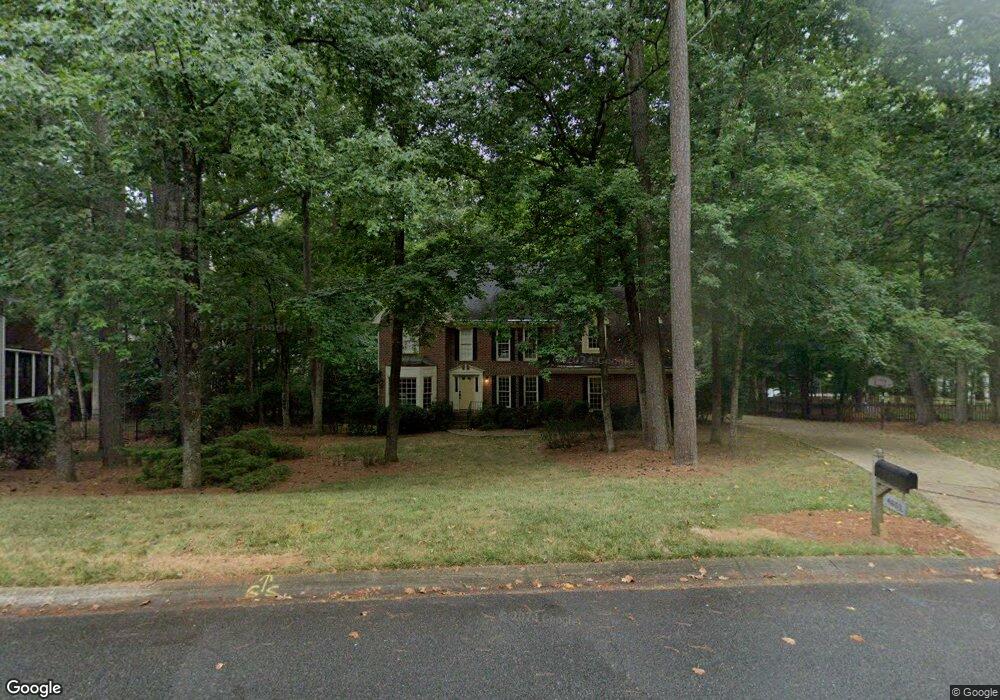
4656 Graywood Trace Unit 3 Norcross, GA 30092
Estimated Value: $646,000 - $746,000
4
Beds
3
Baths
2,801
Sq Ft
$244/Sq Ft
Est. Value
About This Home
This home is located at 4656 Graywood Trace Unit 3, Norcross, GA 30092 and is currently estimated at $684,301, approximately $244 per square foot. 4656 Graywood Trace Unit 3 is a home located in Gwinnett County with nearby schools including Simpson Elementary School, Pinckneyville Middle School, and Norcross High School.
Ownership History
Date
Name
Owned For
Owner Type
Purchase Details
Closed on
Apr 10, 2003
Sold by
Candeub Larry E and Candeub Barbara E
Bought by
Miller Clark K and Miller Susan
Current Estimated Value
Home Financials for this Owner
Home Financials are based on the most recent Mortgage that was taken out on this home.
Original Mortgage
$190,000
Interest Rate
5.81%
Mortgage Type
New Conventional
Purchase Details
Closed on
Aug 11, 1999
Sold by
Sacca Carol A and Sacca James R
Bought by
Candeub Barbra E and Candeub Larry E
Home Financials for this Owner
Home Financials are based on the most recent Mortgage that was taken out on this home.
Original Mortgage
$217,600
Interest Rate
7.65%
Mortgage Type
New Conventional
Purchase Details
Closed on
Dec 27, 1995
Sold by
Searing George Jean
Bought by
Sacca James Carol
Create a Home Valuation Report for This Property
The Home Valuation Report is an in-depth analysis detailing your home's value as well as a comparison with similar homes in the area
Home Values in the Area
Average Home Value in this Area
Purchase History
| Date | Buyer | Sale Price | Title Company |
|---|---|---|---|
| Miller Clark K | $317,500 | -- | |
| Candeub Barbra E | $272,000 | -- | |
| Sacca James Carol | $215,000 | -- | |
| Sacca Carol | $1,000 | -- |
Source: Public Records
Mortgage History
| Date | Status | Borrower | Loan Amount |
|---|---|---|---|
| Closed | Miller Clark K | $190,000 | |
| Previous Owner | Candeub Barbra E | $217,600 | |
| Closed | Sacca Carol | $0 |
Source: Public Records
Tax History Compared to Growth
Tax History
| Year | Tax Paid | Tax Assessment Tax Assessment Total Assessment is a certain percentage of the fair market value that is determined by local assessors to be the total taxable value of land and additions on the property. | Land | Improvement |
|---|---|---|---|---|
| 2025 | $1,980 | $272,280 | $38,000 | $234,280 |
| 2024 | $6,563 | $226,200 | $50,000 | $176,200 |
| 2023 | $6,563 | $226,200 | $50,000 | $176,200 |
| 2022 | $6,195 | $207,920 | $42,000 | $165,920 |
| 2021 | $5,729 | $179,640 | $35,520 | $144,120 |
| 2020 | $5,769 | $179,640 | $35,520 | $144,120 |
| 2019 | $5,355 | $168,080 | $30,000 | $138,080 |
| 2018 | $5,374 | $168,080 | $30,000 | $138,080 |
| 2016 | $4,884 | $147,360 | $24,000 | $123,360 |
| 2015 | $4,937 | $147,360 | $24,000 | $123,360 |
| 2014 | -- | $147,360 | $24,000 | $123,360 |
Source: Public Records
Map
Nearby Homes
- 5863 Revington Dr
- 5465 Fort Fisher Way
- 5465 Fort Fisher Way
- 5545 Fitzpatrick Terrace
- 4531 Outer Bank Dr
- 9005 Old Southwick Pass
- 5397 Valley Mist Ct
- 5221 W Jones Bridge Rd
- 8800 Glen Ferry Dr
- 8870 Glen Ferry Dr Unit 1
- 5350 Wickershire Dr
- 955 Tiverton Ln
- 5354 Fox Hill Dr
- 0 Spyglass Bluff Unit 7666454
- 0 Spyglass Bluff Unit 10628282
- 1285 Stuart Ridge
- 1055 Leadenhall St
- 1050 Bedford Gardens Dr
- 0 Old Southwick Pass Unit 10646630
- 0 Old Southwick Pass Unit 7683754
- 4646 Graywood Trace
- 4654 Fitzpatrick Way Unit 2
- 5643 Creekside Dr
- 5646 Creekside Ct
- 5653 Creekside Dr
- 4655 Graywood Trace
- 4664 Fitzpatrick Way Unit 2
- 4634 Fitzpatrick Way
- 5656 Creekside Ct
- 4645 Graywood Trace
- 5663 Creekside Dr
- 5632 Creekside Dr Unit 3
- 0 Creekside Ct Unit 8572858
- 0 Creekside Ct Unit 8470884
- 0 Creekside Ct Unit 8413298
- 0 Creekside Ct
- 5642 Creekside Dr
- 4635 Graywood Trace
- 4643 Fitzpatrick Way
- 5673 Creekside Dr