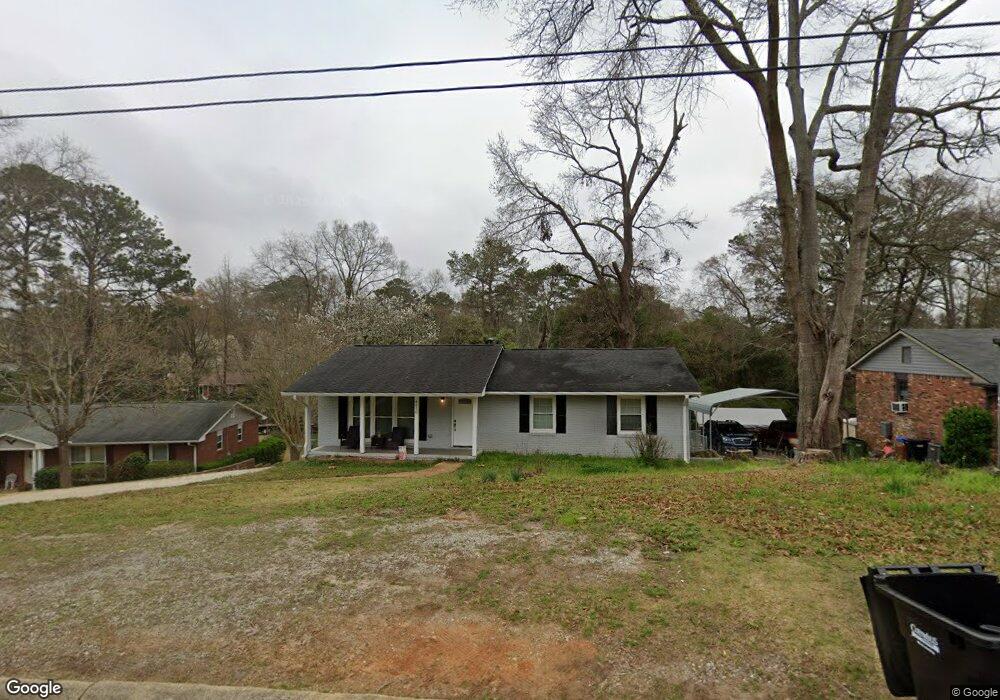
4656 Rowland Ave Columbus, GA 31907
North Columbus NeighborhoodEstimated Value: $155,000 - $206,000
4
Beds
4
Baths
1,248
Sq Ft
$139/Sq Ft
Est. Value
About This Home
This home is located at 4656 Rowland Ave, Columbus, GA 31907 and is currently estimated at $173,145, approximately $138 per square foot. 4656 Rowland Ave is a home located in Muscogee County with nearby schools including Gentian Elementary School, Fort Middle School, and Hardaway High School.
Ownership History
Date
Name
Owned For
Owner Type
Purchase Details
Closed on
Jan 8, 2024
Sold by
Davis Conor B
Bought by
Plutarco Realty Llc
Current Estimated Value
Purchase Details
Closed on
Jan 16, 2018
Sold by
Cnkg Enterprise Llc
Bought by
Davis Conor B and Davis Elery
Home Financials for this Owner
Home Financials are based on the most recent Mortgage that was taken out on this home.
Original Mortgage
$143,005
Interest Rate
3.94%
Mortgage Type
VA
Purchase Details
Closed on
Feb 10, 2017
Sold by
Cnkg Enterprise Llc
Bought by
Cnkg Enterprise Llc and Jones Christopher
Purchase Details
Closed on
Sep 27, 2016
Sold by
Richard Thomas
Bought by
Cnkg Enterprise Llc
Home Financials for this Owner
Home Financials are based on the most recent Mortgage that was taken out on this home.
Original Mortgage
$88,421
Interest Rate
3.46%
Mortgage Type
New Conventional
Create a Home Valuation Report for This Property
The Home Valuation Report is an in-depth analysis detailing your home's value as well as a comparison with similar homes in the area
Home Values in the Area
Average Home Value in this Area
Purchase History
| Date | Buyer | Sale Price | Title Company |
|---|---|---|---|
| Plutarco Realty Llc | -- | None Listed On Document | |
| Plutarco Realty Llc | $131,500 | None Listed On Document | |
| Davis Conor B | $140,000 | -- | |
| Cnkg Enterprise Llc | -- | -- | |
| Cnkg Enterprise Llc | $40,000 | -- |
Source: Public Records
Mortgage History
| Date | Status | Borrower | Loan Amount |
|---|---|---|---|
| Previous Owner | Davis Conor B | $143,005 | |
| Previous Owner | Cnkg Enterprise Llc | $88,421 |
Source: Public Records
Tax History
| Year | Tax Paid | Tax Assessment Tax Assessment Total Assessment is a certain percentage of the fair market value that is determined by local assessors to be the total taxable value of land and additions on the property. | Land | Improvement |
|---|---|---|---|---|
| 2025 | $2,515 | $64,248 | $7,560 | $56,688 |
| 2024 | $2,199 | $56,164 | $7,560 | $48,604 |
| 2023 | $2,354 | $59,764 | $7,560 | $52,204 |
| 2022 | $2,307 | $56,508 | $7,560 | $48,948 |
| 2021 | $1,901 | $46,548 | $7,560 | $38,988 |
| 2020 | $1,901 | $46,548 | $7,560 | $38,988 |
| 2019 | $1,907 | $46,548 | $7,560 | $38,988 |
| 2018 | $1,715 | $41,852 | $7,560 | $34,292 |
| 2017 | $731 | $16,000 | $2,600 | $13,400 |
| 2016 | $1,284 | $31,123 | $4,153 | $26,970 |
| 2015 | $1,285 | $31,123 | $4,153 | $26,970 |
| 2014 | $1,287 | $31,123 | $4,153 | $26,970 |
| 2013 | -- | $31,123 | $4,153 | $26,970 |
Source: Public Records
Map
Nearby Homes
- 4230 Carlene Dr
- 4630 Fairview Dr
- 4133 Pickering Dr
- 4102 Norwood Dr
- 4032 Pickering Dr
- 4038 Sealy Ln
- 4004 Tifton Dr
- 4118 Fairview Dr
- 3935 Tifton Dr
- 4120 Fairview Dr
- 3630 Vernon Dr
- 4738 Shenandoah Dr
- 4409 Smokey Mountain Trail
- 4819 Yosemite Dr
- 5408 Moon Rd
- 3514 Vernon Dr
- 3504 Vernon Dr
- 4413 Dunstan Ct
- 4151 Anglin Rd Unit 22B
- 4151 Anglin Rd Unit 22C
- 4662 Rowland Ave
- 4650 Rowland Ave
- 4668 Rowland Ave
- 4644 Rowland Ave
- 4629 Marie Ave
- 4627 Marie Ave
- 4631 Marie Ave
- 4659 Rowland Ave
- 4638 Rowland Ave
- 4674 Rowland Ave
- 4653 Rowland Ave
- 4669 Rowland Ave
- 4633 Marie Ave
- 4237 Bonnie Dr
- 4229 Bonnie Dr
- 4647 Rowland Ave
- 4677 Rowland Ave
- 4637 Rowland Ave
- 4821 Fairview Dr
- 4680 Rowland Ave
Your Personal Tour Guide
Ask me questions while you tour the home.