Estimated Value: $479,000 - $490,000
4
Beds
2
Baths
1,152
Sq Ft
$419/Sq Ft
Est. Value
About This Home
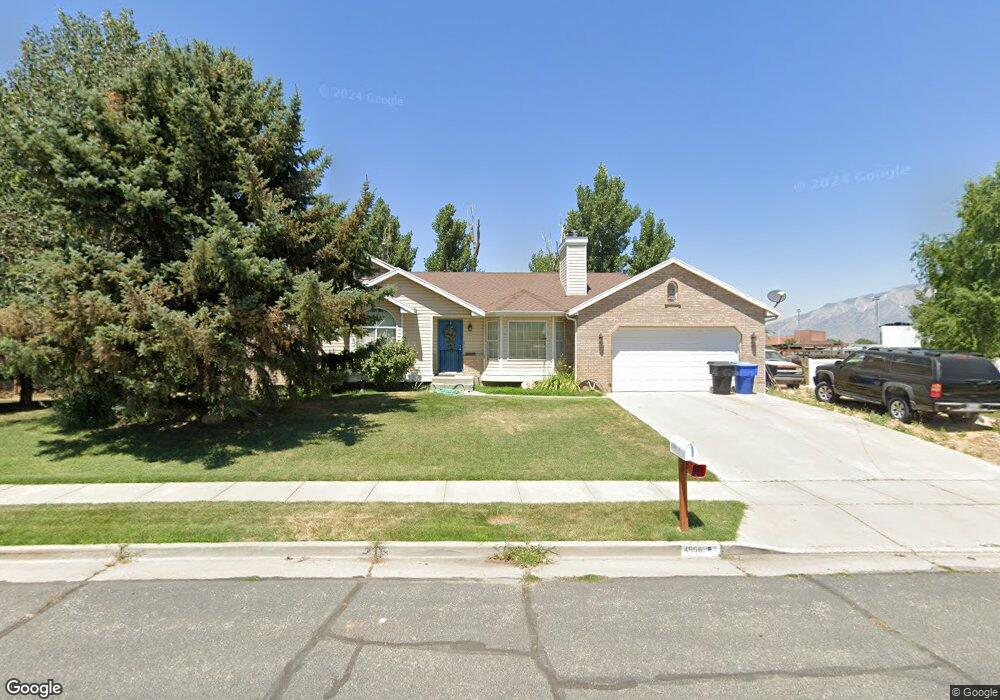
This home is located at 4656 W 1650 N, Ogden, UT 84404 and is currently estimated at $482,842, approximately $419 per square foot. 4656 W 1650 N is a home located in Weber County with nearby schools including Plain City School, Wahlquist Junior High School, and Fremont High School.
Ownership History
Date
Name
Owned For
Owner Type
Purchase Details
Closed on
Sep 17, 2024
Sold by
Searle Shylla
Bought by
Jones Nathan
Current Estimated Value
Purchase Details
Closed on
Jul 8, 2024
Sold by
Searle Kip G
Bought by
Jones Nathan and Searle Shyila
Home Financials for this Owner
Home Financials are based on the most recent Mortgage that was taken out on this home.
Original Mortgage
$397,500
Interest Rate
6.94%
Mortgage Type
New Conventional
Purchase Details
Closed on
Jun 17, 2019
Sold by
Searle Kip G and Green Cary D
Bought by
Searle Kip G
Purchase Details
Closed on
May 30, 2003
Sold by
Nicholls Fred Tracy and Nicholls Becky B
Bought by
Green Gene R
Purchase Details
Closed on
Apr 10, 1997
Sold by
Nicholls Fred Tracy
Bought by
Nicholls Fred Tracy
Home Financials for this Owner
Home Financials are based on the most recent Mortgage that was taken out on this home.
Original Mortgage
$25,000
Interest Rate
7.66%
Mortgage Type
Purchase Money Mortgage
Create a Home Valuation Report for This Property
The Home Valuation Report is an in-depth analysis detailing your home's value as well as a comparison with similar homes in the area
Home Values in the Area
Average Home Value in this Area
Purchase History
| Date | Buyer | Sale Price | Title Company |
|---|---|---|---|
| Jones Nathan | -- | None Listed On Document | |
| Jones Nathan | -- | Cottonwood Title | |
| Searle Kip G | -- | First American Layton | |
| Green Gene R | -- | First American Title | |
| Nicholls Fred Tracy | -- | Associated Title |
Source: Public Records
Mortgage History
| Date | Status | Borrower | Loan Amount |
|---|---|---|---|
| Previous Owner | Jones Nathan | $397,500 | |
| Previous Owner | Nicholls Fred Tracy | $25,000 |
Source: Public Records
Tax History Compared to Growth
Tax History
| Year | Tax Paid | Tax Assessment Tax Assessment Total Assessment is a certain percentage of the fair market value that is determined by local assessors to be the total taxable value of land and additions on the property. | Land | Improvement |
|---|---|---|---|---|
| 2025 | $2,592 | $460,850 | $180,002 | $280,848 |
| 2024 | $2,489 | $249,699 | $99,001 | $150,698 |
| 2023 | $2,491 | $251,350 | $98,992 | $152,358 |
| 2022 | $2,428 | $250,801 | $93,506 | $157,295 |
| 2021 | $2,073 | $356,000 | $80,008 | $275,992 |
| 2020 | $1,966 | $310,000 | $65,047 | $244,953 |
| 2019 | $1,923 | $286,000 | $54,641 | $231,359 |
| 2018 | $1,826 | $258,000 | $54,641 | $203,359 |
| 2017 | $1,667 | $221,000 | $54,641 | $166,359 |
| 2016 | $1,617 | $117,311 | $30,053 | $87,258 |
| 2015 | $1,684 | $120,801 | $30,053 | $90,748 |
| 2014 | $1,421 | $96,870 | $17,959 | $78,911 |
Source: Public Records
Map
Nearby Homes
- 4494 W 1600 N
- 1885 N 4475 W
- 4227 W Pioneer Rd
- 4370 W 1500 N
- 2131 N 4650 W
- 4210 W 1975 N
- 1748 N 4100 St W
- 1239 N 4925 W
- 1221 N 4975 W
- 2416 N 4275 W
- 3966 W 2200 N
- 3622 W 2200 St N Unit 23
- 4212 W 1975 N
- 2700 N 4200 W
- 3594 W 2200 N Unit 3
- 2255 N 3600 St W Unit 21
- 2233 N 3600 St W Unit 22
- 2793 W 2775 N
- 2797 W 2775 N Unit 129
- 2782 W 2775 N Unit 105