Estimated Value: $350,000 - $373,000
--
Bed
--
Bath
2,097
Sq Ft
$173/Sq Ft
Est. Value
About This Home
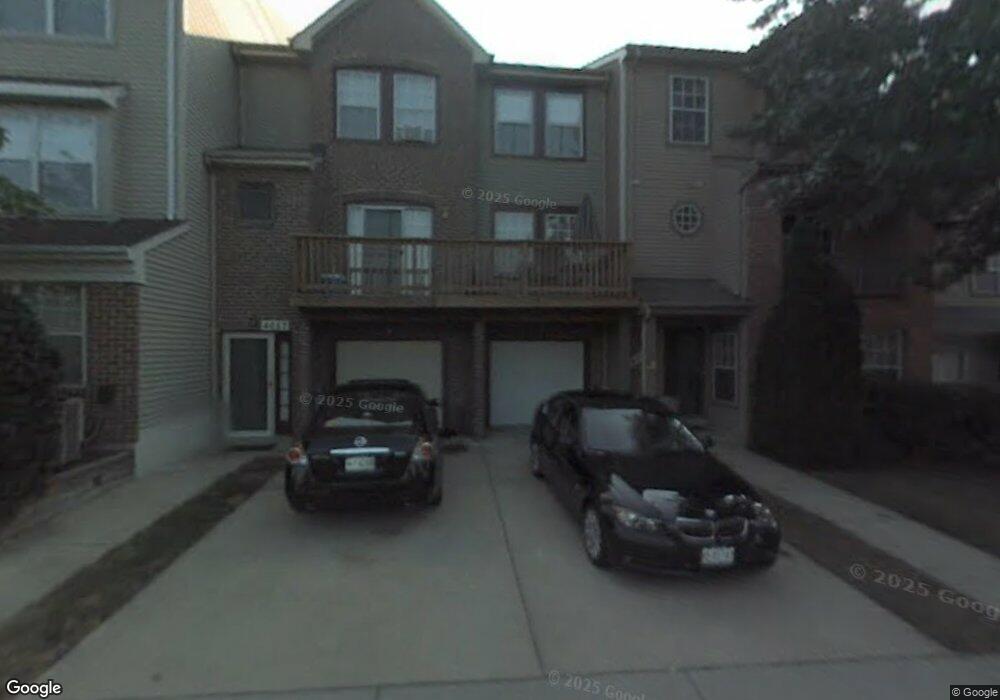
This home is located at 4657 Running Deer Way, Bowie, MD 20720 and is currently estimated at $362,115, approximately $172 per square foot. 4657 Running Deer Way is a home located in Prince George's County with nearby schools including Woodmore Elementary School, Thomas Johnson Middle School, and Duval High School.
Ownership History
Date
Name
Owned For
Owner Type
Purchase Details
Closed on
Feb 5, 2025
Sold by
Nile Holdings Llc
Bought by
Childs Carolyn H
Current Estimated Value
Home Financials for this Owner
Home Financials are based on the most recent Mortgage that was taken out on this home.
Original Mortgage
$349,200
Outstanding Balance
$346,840
Interest Rate
6.95%
Mortgage Type
New Conventional
Estimated Equity
$15,275
Purchase Details
Closed on
May 16, 2016
Sold by
Triad Investments Llc
Bought by
Nile Holdings Llc
Purchase Details
Closed on
Feb 29, 2016
Sold by
Watcher Rebecca L
Bought by
Triad Investments Llc
Purchase Details
Closed on
Dec 1, 2003
Sold by
Muko Ronald M and Muko Sharon L
Bought by
Wachter Rebecca L
Purchase Details
Closed on
Apr 29, 1992
Sold by
Artery Organizatn
Bought by
Muko Ronald M and Muko Sharon L
Create a Home Valuation Report for This Property
The Home Valuation Report is an in-depth analysis detailing your home's value as well as a comparison with similar homes in the area
Home Values in the Area
Average Home Value in this Area
Purchase History
| Date | Buyer | Sale Price | Title Company |
|---|---|---|---|
| Childs Carolyn H | $360,000 | First American Title | |
| Childs Carolyn H | $360,000 | First American Title | |
| Nile Holdings Llc | $153,000 | Brennan Title Company | |
| Triad Investments Llc | $147,500 | Stewart Title Of Md Inc | |
| Wachter Rebecca L | $170,000 | -- | |
| Muko Ronald M | $125,800 | -- |
Source: Public Records
Mortgage History
| Date | Status | Borrower | Loan Amount |
|---|---|---|---|
| Open | Childs Carolyn H | $349,200 | |
| Closed | Childs Carolyn H | $349,200 |
Source: Public Records
Tax History Compared to Growth
Tax History
| Year | Tax Paid | Tax Assessment Tax Assessment Total Assessment is a certain percentage of the fair market value that is determined by local assessors to be the total taxable value of land and additions on the property. | Land | Improvement |
|---|---|---|---|---|
| 2025 | $4,209 | $273,333 | -- | -- |
| 2024 | $4,209 | $256,667 | $0 | $0 |
| 2023 | $2,669 | $240,000 | $72,000 | $168,000 |
| 2022 | $2,521 | $226,667 | $0 | $0 |
| 2021 | $3,762 | $213,333 | $0 | $0 |
| 2020 | $3,366 | $200,000 | $60,000 | $140,000 |
| 2019 | $2,640 | $184,333 | $0 | $0 |
| 2018 | $2,900 | $168,667 | $0 | $0 |
| 2017 | $2,667 | $153,000 | $0 | $0 |
| 2016 | -- | $153,000 | $0 | $0 |
| 2015 | $3,139 | $153,000 | $0 | $0 |
| 2014 | $3,139 | $160,000 | $0 | $0 |
Source: Public Records
Map
Nearby Homes
- 11108 Elon Ct
- 4634 Deepwood Ct
- 4657 Deepwood Ct
- 4811 Lake Ontario Way
- 10907 Atwell Ave
- 4213 Glenn Dale Rd
- 4615 Morning Glory Trail
- 5203 Ashleigh Glen Ct
- 4404 Windflower Way
- 11308 Chantilly Ln
- 11400 Chantilly Ln
- 11500 Chantilly Ln
- 4900 Lisborough Terrace
- 4705 Enterprise Rd
- 10906 Bell Rd
- 10404 Glen Spring Ln
- 10811 Electric Ave
- 0 Bell (Total of Five (5) Lots) Rd Unit MDPG2150980
- 3941 Sunflower Cir
- 10801 Electric Ave
- 4659 Running Deer Way
- 4669 Running Deer Way
- 4661 Running Deer Way
- 4653 Running Deer Way
- 4673 Running Deer Way
- 4663 Running Deer Way
- 4655 Running Deer Way
- 4661 Running Deer Way Unit 366
- 4659 Running Deer Way Unit 365
- 4653 Running Deer Way Unit 362
- 4655 Running Deer Way Unit 363
- 4665 Running Deer Way Unit 368
- 4667 Running Deer Way Unit 369
- 4667 Running Deer Way
- 4671 Running Deer Way Unit 371
- 4671 Running Deer Way
- 4651 Running Deer Way
- 11225 Raging Brook Dr Unit 238C
- 11225 Raging Brook Dr
- 11221 Raging Brook Dr