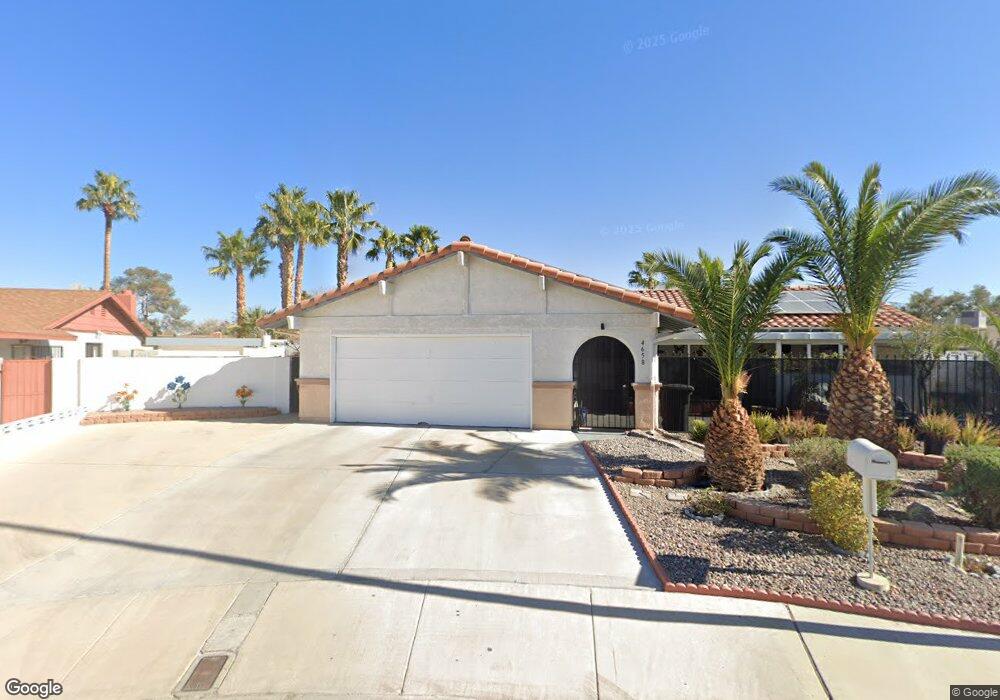
4658 Bullion Ct Las Vegas, NV 89103
Estimated Value: $362,000 - $436,000
3
Beds
2
Baths
1,548
Sq Ft
$263/Sq Ft
Est. Value
About This Home
This home is located at 4658 Bullion Ct, Las Vegas, NV 89103 and is currently estimated at $407,897, approximately $263 per square foot. 4658 Bullion Ct is a home located in Clark County with nearby schools including Harvey N Dondero Elementary School, Kenny C Guinn Middle School, and Durango High School.
Ownership History
Date
Name
Owned For
Owner Type
Purchase Details
Closed on
Oct 21, 2022
Sold by
Friday Paul E
Bought by
Friday Family Revocable Living
Current Estimated Value
Purchase Details
Closed on
Aug 16, 1996
Sold by
Friday Somkid
Bought by
Friday Paul E
Create a Home Valuation Report for This Property
The Home Valuation Report is an in-depth analysis detailing your home's value as well as a comparison with similar homes in the area
Home Values in the Area
Average Home Value in this Area
Purchase History
| Date | Buyer | Sale Price | Title Company |
|---|---|---|---|
| Friday Family Revocable Living | -- | -- | |
| Friday Paul E | -- | -- |
Source: Public Records
Tax History Compared to Growth
Tax History
| Year | Tax Paid | Tax Assessment Tax Assessment Total Assessment is a certain percentage of the fair market value that is determined by local assessors to be the total taxable value of land and additions on the property. | Land | Improvement |
|---|---|---|---|---|
| 2025 | $825 | $69,930 | $38,150 | $31,780 |
| 2024 | $688 | $69,930 | $38,150 | $31,780 |
| 2023 | $688 | $63,352 | $31,850 | $31,502 |
| 2022 | $703 | $58,086 | $28,700 | $29,386 |
| 2021 | $698 | $53,352 | $24,850 | $28,502 |
| 2020 | $665 | $53,252 | $24,500 | $28,752 |
| 2019 | $645 | $49,861 | $21,000 | $28,861 |
| 2018 | $630 | $47,497 | $19,250 | $28,247 |
| 2017 | $795 | $46,915 | $17,850 | $29,065 |
| 2016 | $588 | $42,821 | $12,950 | $29,871 |
| 2015 | $594 | $42,129 | $12,250 | $29,879 |
| 2014 | $573 | $37,157 | $8,750 | $28,407 |
Source: Public Records
Map
Nearby Homes
- 6328 Explorer Dr
- 6284 Explorer Dr
- 6429 Bugbee Ave
- 4481 Ridgeville St
- 4805 S Torrey Pines Dr Unit 201
- 4805 S Torrey Pines Dr Unit 101
- 4835 S Torrey Pines Dr Unit 104
- 4445 Peterson Dr
- 4899 S Torrey Pines Dr Unit 205
- 4847 S Torrey Pines Dr Unit 102
- 4596 Eureka St
- 4877 S Torrey Pines Dr Unit 202
- 4855 S Torrey Pines Dr Unit 102
- 6706 Paljay Ct
- 6280 W University Ave
- 4861 S Torrey Pines Dr Unit 106
- 4865 S Torrey Pines Dr Unit 106
- 6420 Aclare Ave
- 6615 W Tropicana Ave Unit 202
- 6643 W Tropicana Ave Unit 102
- 4650 Bullion Ct
- 4663 Surveyor St
- 4673 Surveyor St
- 4668 Bullion Ct
- 6420 Derek Dr
- 4653 Surveyor St
- 6430 Derek Dr
- 4683 Surveyor St
- 4657 Bullion Ct
- 6440 Derek Dr
- 4649 Bullion Ct
- 6450 Derek Dr
- 6416 Bullion Blvd
- 6426 Bullion Blvd
- 4662 Surveyor St
- 4672 Surveyor St
- 6406 Bullion Blvd
- 4652 Surveyor St
- 6436 Bullion Blvd
- 4682 Surveyor St