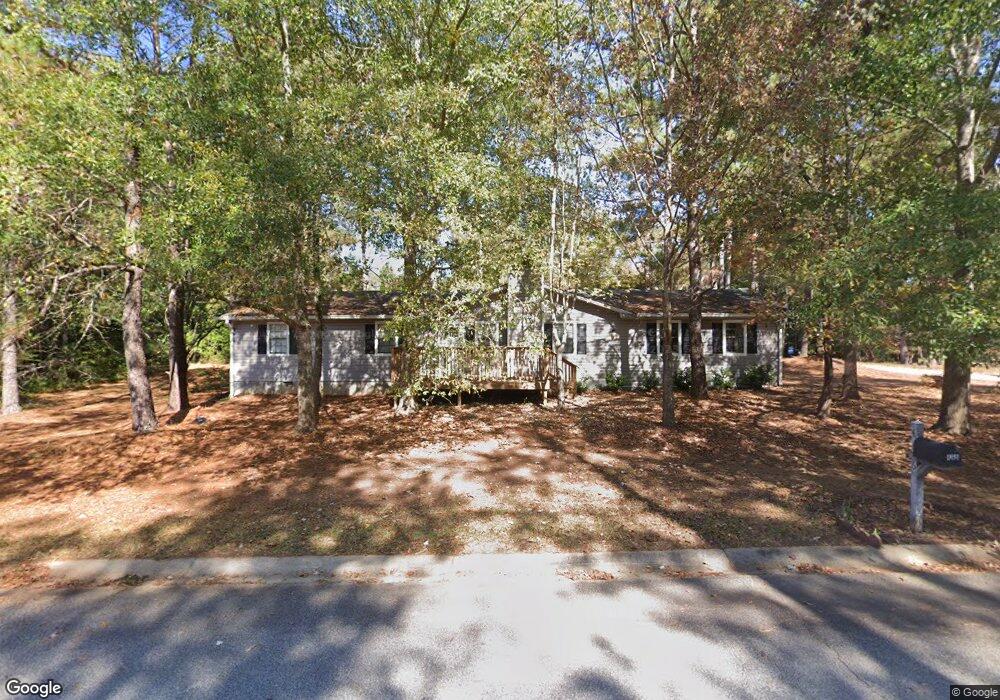
466 Birch Ln SE Conyers, GA 30094
Estimated Value: $208,000 - $234,000
3
Beds
2
Baths
1,367
Sq Ft
$165/Sq Ft
Est. Value
About This Home
This home is located at 466 Birch Ln SE, Conyers, GA 30094 and is currently estimated at $226,058, approximately $165 per square foot. 466 Birch Ln SE is a home located in Rockdale County with nearby schools including Barksdale Elementary School, Gen. Ray Davis Middle School, and Salem High School.
Ownership History
Date
Name
Owned For
Owner Type
Purchase Details
Closed on
May 18, 2022
Sold by
Smith Erica L
Bought by
Rm1 Sfr Propco B Lp
Current Estimated Value
Purchase Details
Closed on
Nov 13, 2009
Sold by
Kenslea Timothy R and Kenslea Randa L
Bought by
Murchland Erica L
Home Financials for this Owner
Home Financials are based on the most recent Mortgage that was taken out on this home.
Original Mortgage
$73,542
Interest Rate
4.92%
Mortgage Type
FHA
Purchase Details
Closed on
Apr 17, 1998
Sold by
Tolcher Raymond W and Tolcher Linda S
Bought by
Telenko Nieata A
Purchase Details
Closed on
Sep 16, 1997
Sold by
Tolcher Raymond W and Tolcher Linda S
Bought by
Kenslea Timothy R and Kenslea Randa L
Home Financials for this Owner
Home Financials are based on the most recent Mortgage that was taken out on this home.
Original Mortgage
$68,300
Interest Rate
7.6%
Mortgage Type
New Conventional
Create a Home Valuation Report for This Property
The Home Valuation Report is an in-depth analysis detailing your home's value as well as a comparison with similar homes in the area
Home Values in the Area
Average Home Value in this Area
Purchase History
| Date | Buyer | Sale Price | Title Company |
|---|---|---|---|
| Rm1 Sfr Propco B Lp | $245,000 | -- | |
| Murchland Erica L | $74,900 | -- | |
| Telenko Nieata A | $15,000 | -- | |
| Kenslea Timothy R | $75,900 | -- |
Source: Public Records
Mortgage History
| Date | Status | Borrower | Loan Amount |
|---|---|---|---|
| Previous Owner | Murchland Erica L | $73,542 | |
| Previous Owner | Kenslea Timothy R | $68,300 |
Source: Public Records
Tax History Compared to Growth
Tax History
| Year | Tax Paid | Tax Assessment Tax Assessment Total Assessment is a certain percentage of the fair market value that is determined by local assessors to be the total taxable value of land and additions on the property. | Land | Improvement |
|---|---|---|---|---|
| 2024 | $2,793 | $69,240 | $16,880 | $52,360 |
| 2023 | $2,943 | $71,280 | $18,320 | $52,960 |
| 2022 | $1,181 | $56,560 | $14,000 | $42,560 |
| 2021 | $853 | $42,080 | $8,360 | $33,720 |
| 2020 | $809 | $41,960 | $8,240 | $33,720 |
| 2019 | $385 | $27,520 | $6,560 | $20,960 |
| 2018 | $317 | $25,240 | $5,160 | $20,080 |
| 2017 | $192 | $21,120 | $3,600 | $17,520 |
| 2016 | $177 | $21,120 | $3,600 | $17,520 |
| 2015 | $194 | $21,680 | $3,600 | $18,080 |
| 2014 | $178 | $21,680 | $3,600 | $18,080 |
| 2013 | -- | $29,720 | $6,000 | $23,720 |
Source: Public Records
Map
Nearby Homes
- 4797 Hemlock Dr SE
- 510 Bell Rd SE Unit 1
- 4811 W Lake Dr SE
- 495 Oglesby Bridge Rd SE
- 570 Bell Rd SE
- 385 Oglesby Bridge Rd SE
- 4938 Lake Forest Dr SE
- 4931 W Lake Dr SE
- 550 Oglesby Bridge Rd SE
- 4740 Shadybrook Way SE
- 4731 Shadybrook Way SE Unit 2
- 4970 Hull Rd SE
- 1023 Plantation Ct SE
- 1459 Highway 212 SW
- 604 Hamlet Ct SE
- 801 Greenwood Trail SE
- 246 Bridgewood Dr SE
- 4980 W Lake Dr SE
- 824 Cedar Lake Dr SE
- 450 Birch Ln SE
- 457 Birch Ln SE
- 0 Hemlock Dr SE Unit 8581551
- 0 Hemlock Dr SE Unit 3148690
- 4785 Hemlock Dr SE
- 4812 Hemlock Dr SE
- 4802 Hemlock Dr SE
- 447 Birch Ln SE
- 4794 Birch Way SE
- 4790 Hemlock Dr SE
- 4822 Hemlock Dr SE
- 4820 Hemlock Dr SE
- 437 Birch Ln SE
- 4780 Hemlock Dr SE
- 4750 Habersham Way SE
- 4795 Birch Way SE Unit 15
- 4795 Birch Way SE
- 4795 Birch Way SE
- 4740 Habersham Way SE
- 0 Birch Ln SE Unit 8568281