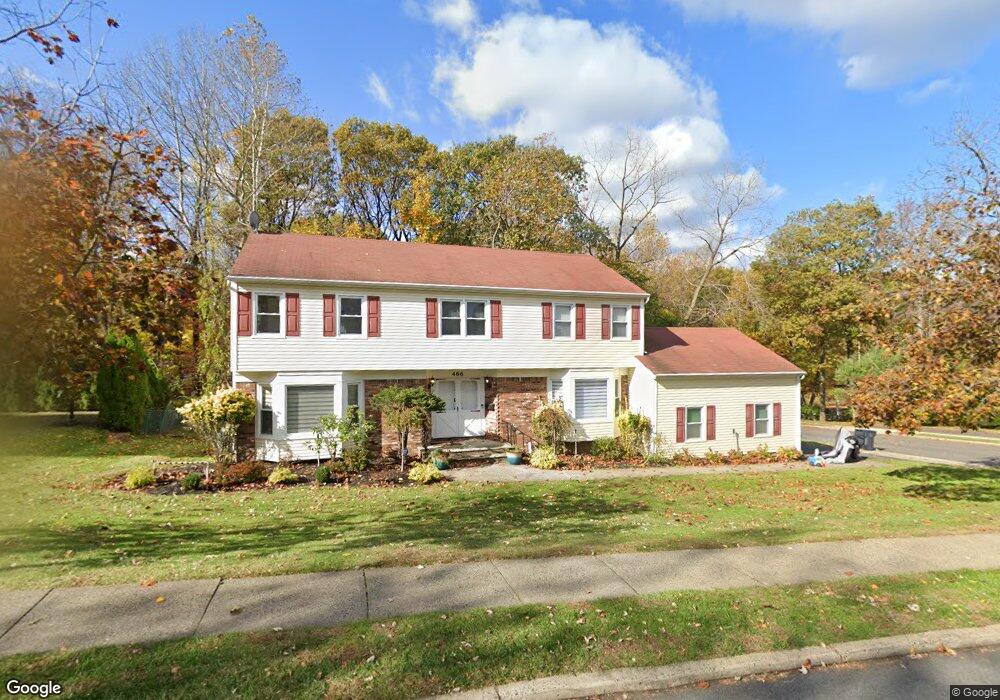
466 Cumberland St Englewood, NJ 07631
Estimated Value: $1,290,068 - $1,340,000
4
Beds
4
Baths
2,602
Sq Ft
$507/Sq Ft
Est. Value
About This Home
This home is located at 466 Cumberland St, Englewood, NJ 07631 and is currently estimated at $1,320,017, approximately $507 per square foot. 466 Cumberland St is a home located in Bergen County with nearby schools including Dr J Grieco Elementary School, Dr Mccloud Elementary School, and J.E. Dismus Middle School.
Ownership History
Date
Name
Owned For
Owner Type
Purchase Details
Closed on
May 14, 2018
Sold by
Lucy Chang
Bought by
Klyman Moshe and Klyman Renee
Current Estimated Value
Home Financials for this Owner
Home Financials are based on the most recent Mortgage that was taken out on this home.
Original Mortgage
$450,000
Outstanding Balance
$387,465
Interest Rate
4.4%
Mortgage Type
New Conventional
Estimated Equity
$932,552
Create a Home Valuation Report for This Property
The Home Valuation Report is an in-depth analysis detailing your home's value as well as a comparison with similar homes in the area
Home Values in the Area
Average Home Value in this Area
Purchase History
| Date | Buyer | Sale Price | Title Company |
|---|---|---|---|
| Klyman Moshe | $737,500 | Berkshire Abst & Title Agcy |
Source: Public Records
Mortgage History
| Date | Status | Borrower | Loan Amount |
|---|---|---|---|
| Open | Klyman Moshe | $450,000 | |
| Closed | Klyman Moshe | $450,000 |
Source: Public Records
Tax History Compared to Growth
Tax History
| Year | Tax Paid | Tax Assessment Tax Assessment Total Assessment is a certain percentage of the fair market value that is determined by local assessors to be the total taxable value of land and additions on the property. | Land | Improvement |
|---|---|---|---|---|
| 2025 | $20,663 | $672,400 | $402,800 | $269,600 |
| 2024 | $20,038 | $672,400 | $402,800 | $269,600 |
| 2023 | $19,829 | $672,400 | $402,800 | $269,600 |
| 2022 | $19,829 | $672,400 | $402,800 | $269,600 |
| 2021 | $19,432 | $672,400 | $402,800 | $269,600 |
| 2020 | $18,928 | $672,400 | $402,800 | $269,600 |
| 2019 | $18,753 | $672,400 | $402,800 | $269,600 |
| 2018 | $18,303 | $672,400 | $402,800 | $269,600 |
| 2017 | $17,758 | $672,400 | $402,800 | $269,600 |
| 2016 | $17,193 | $672,400 | $402,800 | $269,600 |
| 2015 | $17,045 | $672,400 | $402,800 | $269,600 |
| 2014 | $16,904 | $672,400 | $402,800 | $269,600 |
Source: Public Records
Map
Nearby Homes
- 300 Van Nostrand Ave
- 290 Van Nostrand Ave
- 18 Mallard Ct
- 14 Mallard Ct Unit 105
- 505 Adele Ct
- 9 Pheasant Run Unit 137
- 12 Summit St
- 87 Irving Ave
- 229 Allison Ct
- 14 Regency Cir Unit 14
- 636 Jones Rd
- 56 Fox Run Dr
- 66 Elm St
- 470 Myrtle Ave
- 52 Birch St
- 285 Arch Rd
- 184 Jenkins Dr
- 306 Hutchinson Rd
- 135 Rockwood Place
- 485 Westview Place
- 474 Cumberland St
- 461 Cumberland St
- 454 Cumberland St
- 473 Cumberland St
- 453 Cumberland St
- 449 Eton St
- 480 Cumberland St
- 481 Cumberland St
- 446 Cumberland St
- 462 Cape May St
- 454 Cape May St
- 445 Cumberland St
- 441 Eton St
- 488 Cumberland St
- 470 Cape May St
- 446 Cape May St
- 489 Cumberland St
- 438 Cumberland St
- 437 Cumberland St
- 433 Eton St