Estimated Value: $339,000 - $354,000
About This Home
Property Id: 1538276
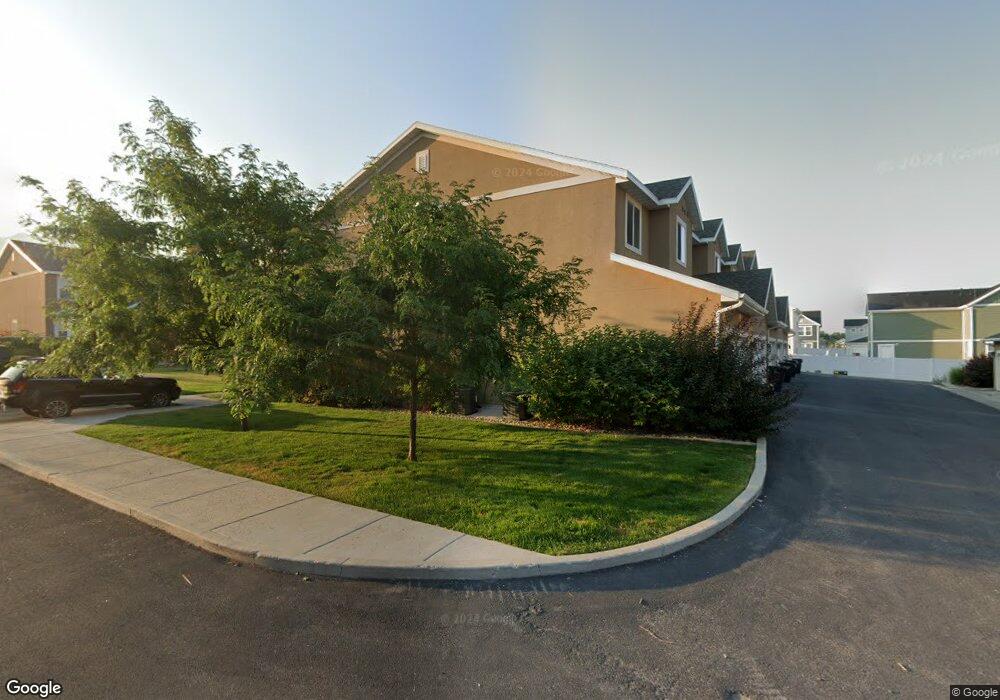
This beautifully maintained townhouse features 3 bedrooms, 2.5 bathrooms, and an open-concept layout perfect for comfortable, modern living. The primary suite includes a spacious ensuite with a soaking tub and a walk-in closet. Enjoy the convenience of a 2-car garage and a location just minutes from schools, shopping, and dining.
Utilities:
Tenants are responsible for gas, electric, and internet.
Rental Criteria:
-Monthly income must be at least 3x the rent
-Credit score of 650 or higher
-Clean criminal record
-Positive rental history
Pets:
Small pets are welcome with a $500 non-refundable fee and $50/month per pet.
For more info or to schedule a showing, call or text Lyssa with Shadow Mountain Realty today!
Ownership History
Purchase Details
Purchase Details
Home Financials for this Owner
Home Financials are based on the most recent Mortgage that was taken out on this home.Home Values in the Area
Average Home Value in this Area
Purchase History
| Date | Buyer | Sale Price | Title Company |
|---|---|---|---|
| Mark And Dianna Norman Family Trust | -- | None Listed On Document | |
| Schvaneveldt Steven L | -- | Hickman Land Title Company |
Mortgage History
| Date | Status | Borrower | Loan Amount |
|---|---|---|---|
| Previous Owner | Schvaneveldt Steven L | $127,000 |
Property History
| Date | Event | Price | List to Sale | Price per Sq Ft |
|---|---|---|---|---|
| 08/28/2025 08/28/25 | Off Market | $1,675 | -- | -- |
| 08/05/2025 08/05/25 | Price Changed | $1,675 | -4.3% | $1 / Sq Ft |
| 07/24/2025 07/24/25 | For Rent | $1,750 | -- | -- |
Tax History Compared to Growth
Tax History
| Year | Tax Paid | Tax Assessment Tax Assessment Total Assessment is a certain percentage of the fair market value that is determined by local assessors to be the total taxable value of land and additions on the property. | Land | Improvement |
|---|---|---|---|---|
| 2025 | $1,299 | $181,865 | $0 | $0 |
| 2024 | $1,385 | $180,360 | $0 | $0 |
| 2023 | $1,670 | $203,555 | $0 | $0 |
| 2022 | $1,767 | $205,755 | $0 | $0 |
| 2021 | $1,355 | $244,609 | $50,000 | $194,609 |
| 2020 | $1,295 | $219,226 | $50,000 | $169,226 |
| 2019 | $1,356 | $219,226 | $50,000 | $169,226 |
| 2018 | $1,155 | $181,095 | $30,000 | $151,095 |
| 2017 | $1,092 | $90,145 | $0 | $0 |
| 2016 | $1,109 | $77,935 | $0 | $0 |
| 2015 | $541 | $43,780 | $0 | $0 |
| 2014 | $241 | $20,000 | $0 | $0 |
Map
- 385 E 2280 N Unit D
- 327 E 2230 N Unit A
- Somerley Plan at Smiling H Ranch
- Viewside Plan at Smiling H Ranch
- Willow Plan at Smiling H Ranch
- Northfield Plan at Smiling H Ranch
- Westbrook Plan at Smiling H Ranch
- Hamilton Plan at Smiling H Ranch
- Foxhill Plan at Smiling H Ranch
- Chamberlain Plan at Smiling H Ranch
- Fairway Plan at Smiling H Ranch
- Oakridge Plan at Smiling H Ranch
- Brantwood Plan at Smiling H Ranch
- Milton Plan at Smiling H Ranch
- Ashland Plan at Smiling H Ranch
- Jefferson Plan at Smiling H Ranch
- Kensington Plan at Smiling H Ranch
- Cambria Plan at Smiling H Ranch
- Lincoln Plan at Smiling H Ranch
- Edgeworth Plan at Smiling H Ranch