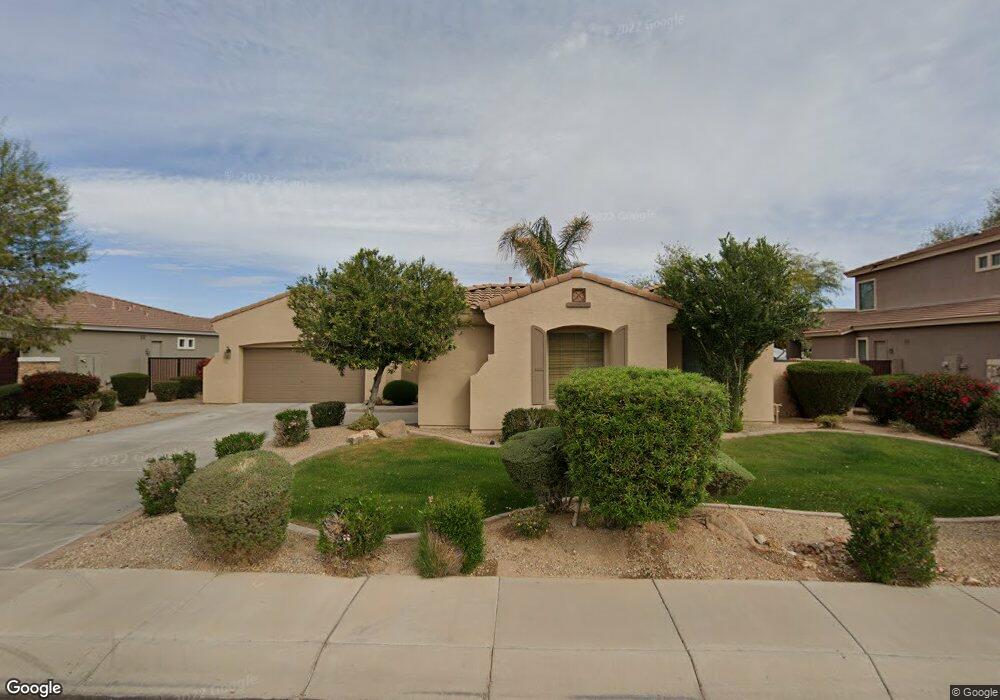
466 E San Carlos Way Chandler, AZ 85249
Ocotillo NeighborhoodEstimated Value: $747,000 - $1,259,000
Studio
5
Baths
2,694
Sq Ft
$394/Sq Ft
Est. Value
About This Home
This home is located at 466 E San Carlos Way, Chandler, AZ 85249 and is currently estimated at $1,061,749, approximately $394 per square foot. 466 E San Carlos Way is a home located in Maricopa County with nearby schools including Fulton Elementary School, Santan Junior High School, and Hamilton High School.
Ownership History
Date
Name
Owned For
Owner Type
Purchase Details
Closed on
Sep 2, 2005
Sold by
Hoang Johnny Y
Bought by
Hoang Johnny T and Nguyen Julie
Current Estimated Value
Home Financials for this Owner
Home Financials are based on the most recent Mortgage that was taken out on this home.
Original Mortgage
$240,000
Outstanding Balance
$121,270
Interest Rate
5.56%
Mortgage Type
New Conventional
Estimated Equity
$940,479
Purchase Details
Closed on
Jul 27, 2005
Sold by
Schuler Homes Of Arizona Llc
Bought by
Hoang Johnny T
Home Financials for this Owner
Home Financials are based on the most recent Mortgage that was taken out on this home.
Original Mortgage
$240,000
Outstanding Balance
$121,270
Interest Rate
5.56%
Mortgage Type
New Conventional
Estimated Equity
$940,479
Purchase Details
Closed on
Sep 27, 2002
Sold by
Ellis Helen
Bought by
Ellis William E
Create a Home Valuation Report for This Property
The Home Valuation Report is an in-depth analysis detailing your home's value as well as a comparison with similar homes in the area
Home Values in the Area
Average Home Value in this Area
Purchase History
| Date | Buyer | Sale Price | Title Company |
|---|---|---|---|
| Hoang Johnny T | -- | -- | |
| Hoang Johnny T | $537,773 | -- | |
| Ellis William E | -- | Chicago Title Insurance Co |
Source: Public Records
Mortgage History
| Date | Status | Borrower | Loan Amount |
|---|---|---|---|
| Open | Hoang Johnny T | $240,000 |
Source: Public Records
Tax History
| Year | Tax Paid | Tax Assessment Tax Assessment Total Assessment is a certain percentage of the fair market value that is determined by local assessors to be the total taxable value of land and additions on the property. | Land | Improvement |
|---|---|---|---|---|
| 2025 | $5,493 | $64,682 | -- | -- |
| 2024 | $5,837 | $61,602 | -- | -- |
| 2023 | $5,837 | $81,360 | $16,270 | $65,090 |
| 2022 | $5,653 | $65,700 | $13,140 | $52,560 |
| 2021 | $5,810 | $62,630 | $12,520 | $50,110 |
| 2020 | $5,778 | $60,500 | $12,100 | $48,400 |
| 2019 | $5,575 | $55,120 | $11,020 | $44,100 |
| 2018 | $5,417 | $52,260 | $10,450 | $41,810 |
| 2017 | $5,089 | $51,760 | $10,350 | $41,410 |
| 2016 | $5,515 | $49,830 | $9,960 | $39,870 |
| 2015 | $4,113 | $48,200 | $9,640 | $38,560 |
Source: Public Records
Map
Nearby Homes
- 529 E San Carlos Way
- 554 E San Carlos Way
- 4760 S Nevada St
- 4730 S Robins Way
- 14 W Blue Ridge Way
- 855 E Mead Dr
- 838 E Nolan Place
- 709 E Prescott Dr
- 904 E Mead Dr
- 257 E Kaibab Dr
- 130 E Elmwood Place
- 921 E Canyon Way
- 63 W Cedar Dr
- 191 W Beechnut Place
- 4940 S Springs Dr
- 5212 S Monte Vista St
- 30 W Tonto Dr
- 5440 S Arizona Place
- 4560 S Springs Dr
- 773 E Glacier Dr
- 476 E San Carlos Way
- 456 E San Carlos Way
- 446 E San Carlos Way
- 436 E San Carlos Way
- 455 E Lynx Way
- 465 E Lynx Way
- 445 E Lynx Way
- 4878 S Fresno St
- 4888 S Fresno St
- 426 E San Carlos Way
- 435 E Lynx Way
- 4898 S Fresno St
- 4868 S Fresno St
- 425 E Lynx Way
- 4887 S Exeter St
- 492 E Rainbow Dr
- 4795 S Virginia Way
- 454 E Lynx Way
- 4877 S Exeter St
- 415 E Lynx Way
Your Personal Tour Guide
Ask me questions while you tour the home.