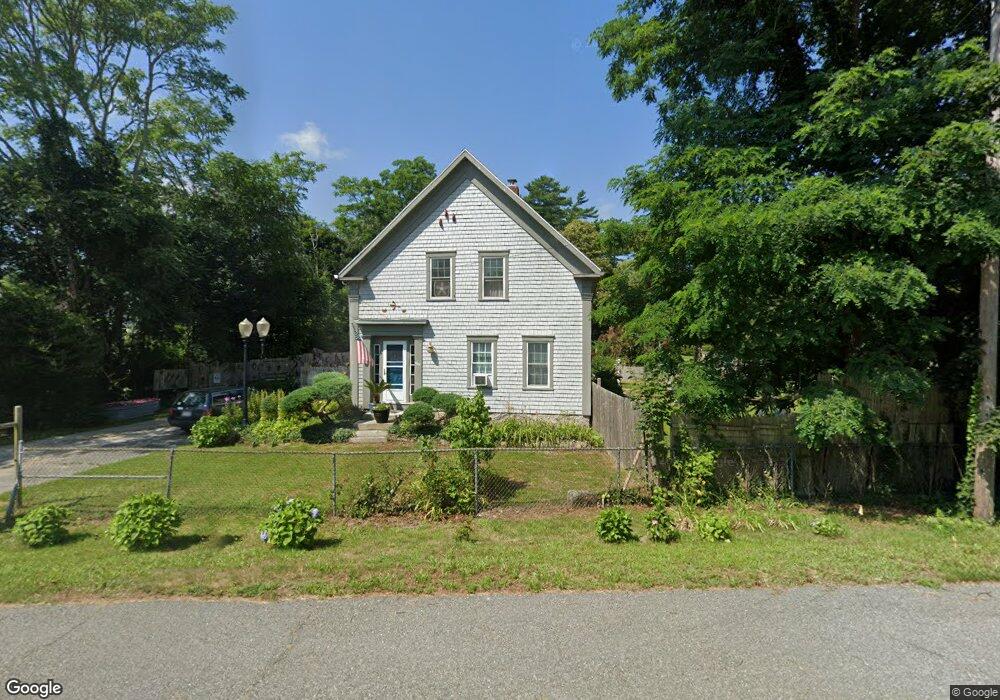
466 Front St Marion, MA 02738
Estimated Value: $572,000 - $811,000
4
Beds
2
Baths
2,554
Sq Ft
$277/Sq Ft
Est. Value
About This Home
This home is located at 466 Front St, Marion, MA 02738 and is currently estimated at $708,211, approximately $277 per square foot. 466 Front St is a home located in Plymouth County with nearby schools including Old Rochester Regional High School and Tabor Academy.
Ownership History
Date
Name
Owned For
Owner Type
Purchase Details
Closed on
Dec 7, 2023
Sold by
Connor Susan K and Connor Kenneth M
Bought by
Sk Connor Ft and Connor
Current Estimated Value
Purchase Details
Closed on
Dec 16, 2009
Sold by
Connor Susan K and Johnson Susan J
Bought by
Connor Susan K and Connor Kenneth M
Home Financials for this Owner
Home Financials are based on the most recent Mortgage that was taken out on this home.
Original Mortgage
$160,000
Interest Rate
5%
Mortgage Type
Purchase Money Mortgage
Create a Home Valuation Report for This Property
The Home Valuation Report is an in-depth analysis detailing your home's value as well as a comparison with similar homes in the area
Purchase History
| Date | Buyer | Sale Price | Title Company |
|---|---|---|---|
| Sk Connor Ft | -- | None Available | |
| Connor Susan K | -- | -- |
Source: Public Records
Mortgage History
| Date | Status | Borrower | Loan Amount |
|---|---|---|---|
| Previous Owner | Connor Susan K | $100,000 | |
| Previous Owner | Connor Susan K | $160,000 |
Source: Public Records
Tax History
| Year | Tax Paid | Tax Assessment Tax Assessment Total Assessment is a certain percentage of the fair market value that is determined by local assessors to be the total taxable value of land and additions on the property. | Land | Improvement |
|---|---|---|---|---|
| 2025 | $5,140 | $551,500 | $194,100 | $357,400 |
| 2024 | $4,639 | $501,000 | $169,800 | $331,200 |
| 2023 | $5,169 | $547,600 | $242,600 | $305,000 |
| 2022 | $5,614 | $517,400 | $149,300 | $368,100 |
| 2021 | $4,349 | $446,300 | $130,600 | $315,700 |
| 2020 | $4,731 | $404,400 | $130,600 | $273,800 |
| 2019 | $4,395 | $398,500 | $130,600 | $267,900 |
| 2018 | $3,971 | $346,800 | $129,100 | $217,700 |
| 2017 | $3,479 | $329,100 | $129,100 | $200,000 |
| 2016 | $3,442 | $304,300 | $129,100 | $175,200 |
| 2015 | $3,542 | $318,800 | $136,500 | $182,300 |
Source: Public Records
Map
Nearby Homes
- 460 Front St
- 454 Front St
- 453 Front St
- 2 Washburn Park Rd
- 449 Front St
- 464 Front St
- 448 Front St
- 444 Front St
- 5 Washburn Park Rd
- 438 Front St
- 433 Front St
- 430 Front St
- 429 Front St
- 428 Front St
- 4 Derby Ln
- 424 Front St
- 421 Front St
- 6 Derby Ln
- 418 Front St Unit 1
- 418 Front St Unit 418 Front St. Marion
Your Personal Tour Guide
Ask me questions while you tour the home.