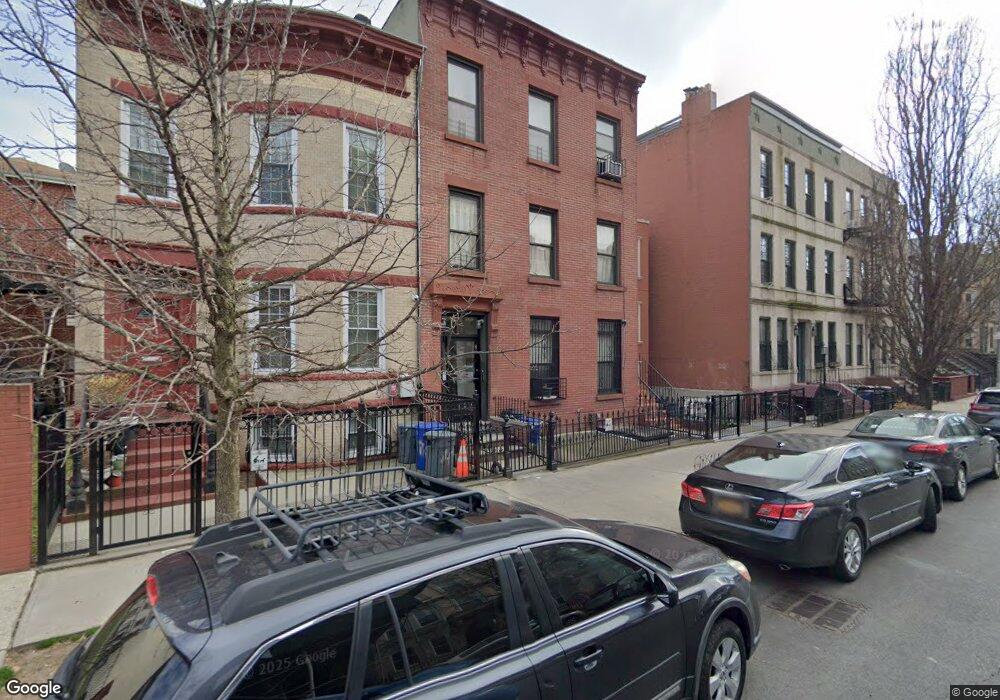
466 Hancock St Unit 3 Brooklyn, NY 11233
Bed-Stuy NeighborhoodEstimated Value: $1,405,000 - $1,779,000
2
Beds
1
Bath
--
Sq Ft
--
Built
About This Home
This home is located at 466 Hancock St Unit 3, Brooklyn, NY 11233 and is currently estimated at $1,583,775. 466 Hancock St Unit 3 is a home located in Kings County with nearby schools including P.S. 262 El Hajj Malik El Shabazz Elementary School, La Cima Charter School, and Ember Charter School.
Ownership History
Date
Name
Owned For
Owner Type
Purchase Details
Closed on
Sep 19, 2025
Sold by
Marjorie Dalrymple
Bought by
Simon Alberto
Current Estimated Value
Home Financials for this Owner
Home Financials are based on the most recent Mortgage that was taken out on this home.
Original Mortgage
$778,706
Outstanding Balance
$774,490
Interest Rate
6.58%
Mortgage Type
New Conventional
Estimated Equity
$809,285
Purchase Details
Closed on
Aug 17, 2012
Sold by
209 Lexington Corp
Bought by
Dalrymple Marjorie
Home Financials for this Owner
Home Financials are based on the most recent Mortgage that was taken out on this home.
Original Mortgage
$618,640
Interest Rate
3.61%
Mortgage Type
New Conventional
Purchase Details
Closed on
Nov 10, 2011
Sold by
Scott Carol Anthony
Bought by
209 Lexington Corp
Home Financials for this Owner
Home Financials are based on the most recent Mortgage that was taken out on this home.
Original Mortgage
$270,000
Interest Rate
4.01%
Mortgage Type
Purchase Money Mortgage
Purchase Details
Closed on
Oct 15, 1997
Sold by
Va
Bought by
Scott Carol
Purchase Details
Closed on
Jan 18, 1994
Sold by
Scott Carol Anthony
Bought by
Scott Carol Anthony
Create a Home Valuation Report for This Property
The Home Valuation Report is an in-depth analysis detailing your home's value as well as a comparison with similar homes in the area
Home Values in the Area
Average Home Value in this Area
Purchase History
| Date | Buyer | Sale Price | Title Company |
|---|---|---|---|
| Simon Alberto | $1,312,500 | Judicial Title Insurance Agenc | |
| Dalrymple Marjorie | $640,000 | -- | |
| Dalrymple Marjorie | $640,000 | -- | |
| 209 Lexington Corp | $280,000 | -- | |
| 209 Lexington Corp | $280,000 | -- | |
| Scott Carol | $28,500 | -- | |
| Scott Carol | $28,500 | -- | |
| Scott Carol Anthony | -- | -- | |
| Scott Carol Anthony | -- | -- |
Source: Public Records
Mortgage History
| Date | Status | Borrower | Loan Amount |
|---|---|---|---|
| Open | Simon Alberto | $778,706 | |
| Previous Owner | Dalrymple Marjorie | $618,640 | |
| Previous Owner | 209 Lexington Corp | $270,000 |
Source: Public Records
Map
Nearby Homes
- 460 Hancock St
- 456 Hancock St
- 479 Hancock St
- 487 Hancock St
- 493 Hancock St
- 425 Halsey St
- 416 Halsey St
- 429 Hancock St
- 621 Putnam Ave
- 347 Halsey St
- 470 Jefferson Ave
- 583 Putnam Ave Unit 4
- 583 Putnam Ave Unit 3
- 539 Hancock St
- 485 Halsey St
- 688 Putnam Ave
- 524 Halsey St Unit TH1
- 524 Halsey St Unit 107
- 524 Halsey St Unit 105
- 613 Jefferson Ave Unit 1
- 468 Hancock St
- 470 Hancock St
- 464 Hancock St
- 464 Hancock St Unit 2B
- 464 Hancock St Unit 2A
- 464 Hancock St Unit 1A
- 464 Hancock St Unit 1B
- 464 Hancock St Unit 3B
- 464 Hancock St Unit 3-A
- 462 Hancock St
- 462 Hancock St Unit 6
- 472 Hancock St
- 460A Hancock St
- 460A Hancock St Unit 2
- 460A Hancock St Unit 1
- 460 Hancock St Unit 3
- 460 Hancock St Unit 2
- 460 Hancock St Unit 1
- 460 Hancock St Unit HOUSE
- 474 Hancock St
Your Personal Tour Guide
Ask me questions while you tour the home.