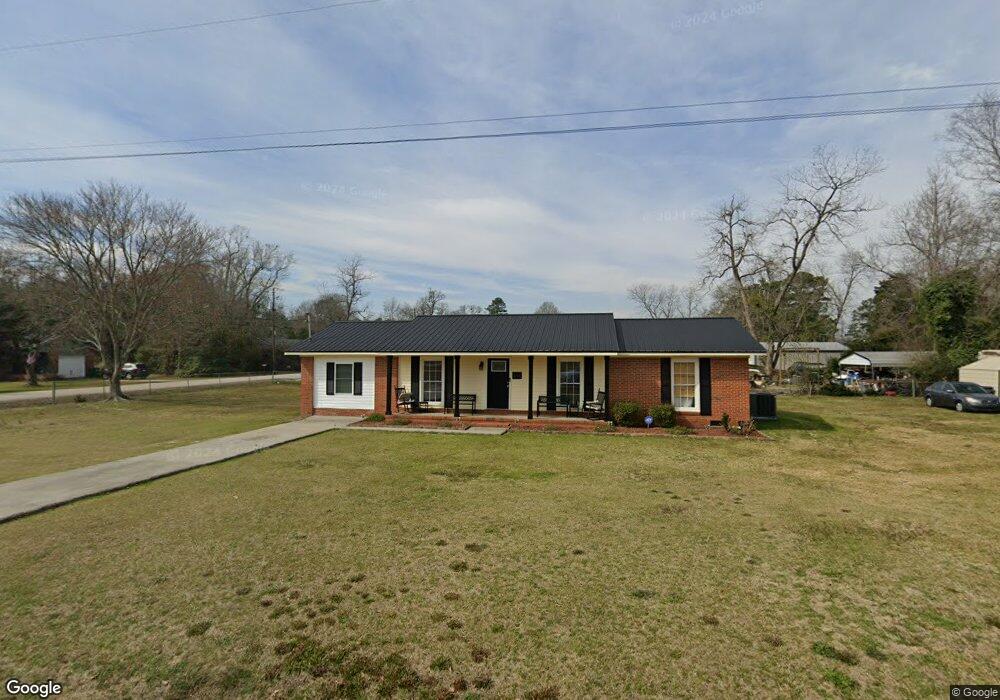
466 S Jay St Stapleton, GA 30823
Estimated Value: $167,000 - $254,000
3
Beds
3
Baths
1,450
Sq Ft
$140/Sq Ft
Est. Value
About This Home
This home is located at 466 S Jay St, Stapleton, GA 30823 and is currently estimated at $202,682, approximately $139 per square foot. 466 S Jay St is a home located in Jefferson County with nearby schools including Jefferson County High School.
Ownership History
Date
Name
Owned For
Owner Type
Purchase Details
Closed on
Apr 11, 2023
Sold by
Morrison Matthew Brooks
Bought by
Zeigler Glynn Lee and Zeigler Frances Ynn
Current Estimated Value
Purchase Details
Closed on
Feb 12, 2019
Sold by
Mercer Monica P
Bought by
Morrison Matthew Brooks
Home Financials for this Owner
Home Financials are based on the most recent Mortgage that was taken out on this home.
Original Mortgage
$98,135
Interest Rate
4.4%
Purchase Details
Closed on
Apr 4, 2014
Sold by
Mcnair James L
Bought by
Mercer Monica P
Home Financials for this Owner
Home Financials are based on the most recent Mortgage that was taken out on this home.
Original Mortgage
$63,000
Interest Rate
4.33%
Mortgage Type
New Conventional
Purchase Details
Closed on
Aug 29, 2013
Sold by
Barrow Tommy W
Bought by
Mcnair James L and Mcnair Linda J
Create a Home Valuation Report for This Property
The Home Valuation Report is an in-depth analysis detailing your home's value as well as a comparison with similar homes in the area
Purchase History
| Date | Buyer | Sale Price | Title Company |
|---|---|---|---|
| Zeigler Glynn Lee | -- | -- | |
| Morrison Matthew Brooks | $95,000 | -- | |
| Mercer Monica P | $60,000 | -- | |
| Mcnair James L | $30,000 | -- |
Source: Public Records
Mortgage History
| Date | Status | Borrower | Loan Amount |
|---|---|---|---|
| Previous Owner | Morrison Matthew Brooks | $98,135 | |
| Previous Owner | Mercer Monica P | $63,000 |
Source: Public Records
Tax History
| Year | Tax Paid | Tax Assessment Tax Assessment Total Assessment is a certain percentage of the fair market value that is determined by local assessors to be the total taxable value of land and additions on the property. | Land | Improvement |
|---|---|---|---|---|
| 2025 | $2,409 | $56,983 | $1,012 | $55,971 |
| 2024 | $2,049 | $52,182 | $1,012 | $51,170 |
| 2023 | $1,724 | $41,714 | $1,012 | $40,702 |
| 2022 | $1,126 | $35,948 | $1,012 | $34,936 |
| 2021 | $1,145 | $35,016 | $1,012 | $34,004 |
| 2020 | $1,141 | $34,804 | $1,012 | $33,792 |
| 2019 | $543 | $16,276 | $1,012 | $15,264 |
| 2018 | $553 | $16,274 | $1,012 | $15,262 |
| 2017 | $572 | $16,808 | $1,012 | $15,796 |
| 2016 | $511 | $16,542 | $1,012 | $15,530 |
| 2015 | -- | $16,620 | $1,012 | $15,608 |
| 2014 | -- | $17,306 | $1,012 | $16,294 |
| 2013 | -- | $17,672 | $1,012 | $16,660 |
Source: Public Records
Map
Nearby Homes
- 651 Harvey St
- 1234 Stapleton Acres Rd
- Lot 32 Stapleton Acres Dr
- 169 E Sheppard St
- 3191 Gene Howard Rd
- 1289 Brittany St
- 10199 Ga Highway 296
- 1300 Terry Dr
- 9694 Broad St
- 1167 Shaunee Ln
- 15094 Clarks Mill Rd
- 6975 Georgia 80
- 203 S Wrens Cir
- 3 Stone Springfield Church Rd
- 2 Stone Springfield Church Rd
- 207 Old Thomson Rd
- 0 Old Thomson Rd
- 0 Hwy 80 and Old Stapleton Rd Unit 10622530
- 407 Russell St
- 109 Matthews St
Your Personal Tour Guide
Ask me questions while you tour the home.