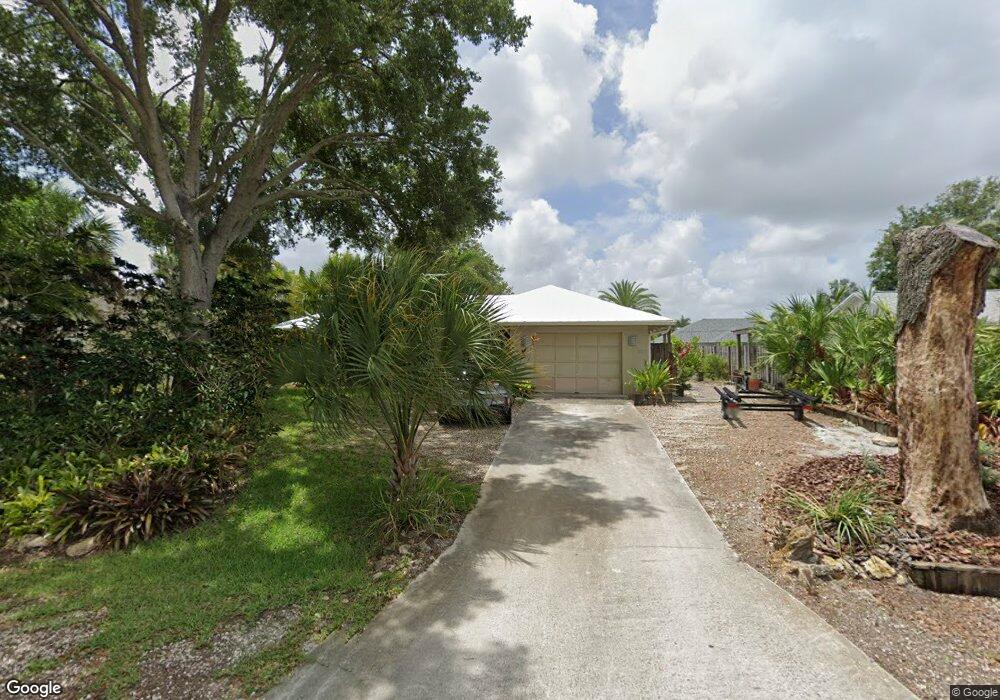
466 SE Langfield Ave Port Saint Lucie, FL 34984
Canal Pointe NeighborhoodEstimated Value: $248,000 - $308,000
2
Beds
2
Baths
1,294
Sq Ft
$222/Sq Ft
Est. Value
About This Home
This home is located at 466 SE Langfield Ave, Port Saint Lucie, FL 34984 and is currently estimated at $287,034, approximately $221 per square foot. 466 SE Langfield Ave is a home located in St. Lucie County with nearby schools including Floresta Elementary School, Morningside Elementary School, and Mariposa Elementary School.
Ownership History
Date
Name
Owned For
Owner Type
Purchase Details
Closed on
Dec 7, 2020
Sold by
Walsh James G and Walsh Angee
Bought by
Walsh Cory Nathan
Current Estimated Value
Purchase Details
Closed on
May 6, 2011
Sold by
Shaneman Audra and Shaneman Michael
Bought by
Walsh James G and Walsh Angee
Home Financials for this Owner
Home Financials are based on the most recent Mortgage that was taken out on this home.
Original Mortgage
$55,200
Outstanding Balance
$38,273
Interest Rate
4.83%
Mortgage Type
New Conventional
Estimated Equity
$248,761
Purchase Details
Closed on
Apr 5, 2005
Sold by
Peddicord Stephen F
Bought by
Schafer Audra
Home Financials for this Owner
Home Financials are based on the most recent Mortgage that was taken out on this home.
Original Mortgage
$61,500
Interest Rate
5.62%
Mortgage Type
Purchase Money Mortgage
Create a Home Valuation Report for This Property
The Home Valuation Report is an in-depth analysis detailing your home's value as well as a comparison with similar homes in the area
Home Values in the Area
Average Home Value in this Area
Purchase History
| Date | Buyer | Sale Price | Title Company |
|---|---|---|---|
| Walsh Cory Nathan | -- | Attorney | |
| Walsh James G | $69,200 | Attorney | |
| Schafer Audra | $61,500 | First American Title Ins Co |
Source: Public Records
Mortgage History
| Date | Status | Borrower | Loan Amount |
|---|---|---|---|
| Open | Walsh James G | $55,200 | |
| Previous Owner | Schafer Audra | $61,500 |
Source: Public Records
Tax History Compared to Growth
Tax History
| Year | Tax Paid | Tax Assessment Tax Assessment Total Assessment is a certain percentage of the fair market value that is determined by local assessors to be the total taxable value of land and additions on the property. | Land | Improvement |
|---|---|---|---|---|
| 2024 | $3,257 | $164,127 | -- | -- |
| 2023 | $3,257 | $159,347 | $0 | $0 |
| 2022 | $3,118 | $154,706 | $0 | $0 |
| 2021 | $3,032 | $150,200 | $60,000 | $90,200 |
| 2020 | $3,011 | $132,300 | $48,000 | $84,300 |
| 2019 | $2,876 | $127,500 | $40,000 | $87,500 |
| 2018 | $2,430 | $94,100 | $34,000 | $60,100 |
| 2017 | $2,253 | $80,200 | $28,000 | $52,200 |
| 2016 | $2,056 | $67,200 | $21,600 | $45,600 |
| 2015 | $1,909 | $57,500 | $14,000 | $43,500 |
| 2014 | $1,736 | $53,130 | $0 | $0 |
Source: Public Records
Map
Nearby Homes
- 2549 SE Appleby St
- 2456 SE Blackhorse St
- 434 SE Oakridge Dr
- 582 SE Essex Dr
- 372 SE Oakridge Dr
- 566 SE Oakridge Dr
- 106 SW Airview Ave
- 699 SE Delancey Ln
- 671 SE Delancey Ln
- 681 SE Delancey Ln
- 691 SE Delancey Ln
- 2458 SE Wald St
- 2462 SE Watercrest St
- 115 SW Oakridge Dr
- 2329 SE Glover St
- 2450 SW Summit St
- 2482 SE Floresta Dr
- 13865 SE Blackwood Dr
- 2426 SE Stonecrop St
- 710 SE Essex Dr
- 450 SE Langfield Ave
- 482 SE Langfield Ave
- 465 SE Inwood Ave
- 449 SE Inwood Ave
- 481 SE Inwood Ave
- 457 SE Langfield Ave
- 2540 SE Appleby St
- 2548 SE Appleby St
- 471 SE Langfield Ave
- 433 SE Inwood Ave
- 443 SE Langfield Ave
- 2556 SE Appleby St
- 418 SE Langfield Ave
- 485 SE Ave
- 485 SE Langfield Ave
- 429 SE Langfield Ave
- 417 SE Inwood Ave
- 415 SE Langfield Ave
- 472 SE Inwood Ave
- 499 SE Langfield Ave