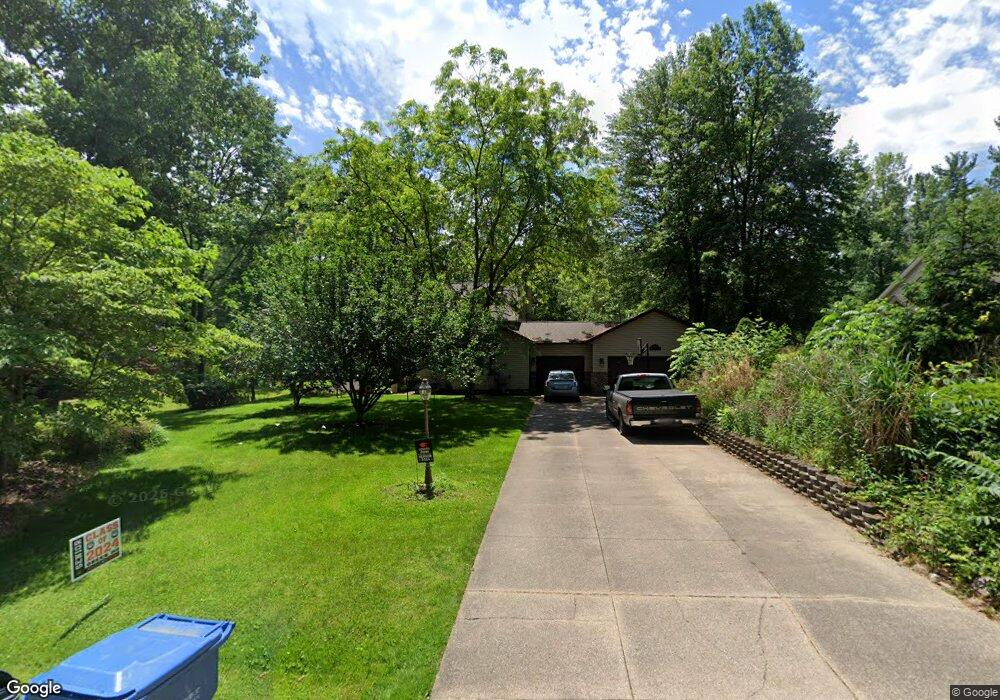
466 Stoner Rd Clinton, OH 44216
Estimated Value: $440,712 - $504,000
4
Beds
3
Baths
3,046
Sq Ft
$157/Sq Ft
Est. Value
About This Home
This home is located at 466 Stoner Rd, Clinton, OH 44216 and is currently estimated at $478,178, approximately $156 per square foot. 466 Stoner Rd is a home located in Summit County with nearby schools including Greenwood Elementary School, Green Intermediate Elementary School, and Green Primary School.
Ownership History
Date
Name
Owned For
Owner Type
Purchase Details
Closed on
Jan 25, 2007
Sold by
Fosse David K and Fosse Tia
Bought by
Pace Shawn C and Pace Tina N
Current Estimated Value
Home Financials for this Owner
Home Financials are based on the most recent Mortgage that was taken out on this home.
Original Mortgage
$176,000
Interest Rate
6.19%
Mortgage Type
Purchase Money Mortgage
Purchase Details
Closed on
Jun 28, 2001
Sold by
Shump Dianne and Shump Dianne K
Bought by
Fosse David K and Fosse Tia
Home Financials for this Owner
Home Financials are based on the most recent Mortgage that was taken out on this home.
Original Mortgage
$149,600
Interest Rate
6.5%
Purchase Details
Closed on
Apr 3, 2000
Sold by
Shump Reed S and Shump Reed D
Bought by
Shump Dianne and Shump Dianne K
Create a Home Valuation Report for This Property
The Home Valuation Report is an in-depth analysis detailing your home's value as well as a comparison with similar homes in the area
Purchase History
| Date | Buyer | Sale Price | Title Company |
|---|---|---|---|
| Pace Shawn C | $220,000 | Chicago Title Insurance Co | |
| Fosse David K | $187,000 | Real Estate Title | |
| Shump Dianne | -- | -- |
Source: Public Records
Mortgage History
| Date | Status | Borrower | Loan Amount |
|---|---|---|---|
| Previous Owner | Pace Shawn C | $176,000 | |
| Previous Owner | Fosse David K | $149,600 |
Source: Public Records
Tax History
| Year | Tax Paid | Tax Assessment Tax Assessment Total Assessment is a certain percentage of the fair market value that is determined by local assessors to be the total taxable value of land and additions on the property. | Land | Improvement |
|---|---|---|---|---|
| 2024 | $6,194 | $128,356 | $15,925 | $112,431 |
| 2023 | $6,194 | $128,356 | $15,925 | $112,431 |
| 2022 | $4,969 | $93,111 | $11,540 | $81,571 |
| 2021 | $4,690 | $93,111 | $11,540 | $81,571 |
| 2020 | $4,602 | $93,110 | $11,540 | $81,570 |
| 2019 | $3,600 | $68,630 | $13,610 | $55,020 |
| 2018 | $3,683 | $68,630 | $13,610 | $55,020 |
| 2017 | $3,709 | $68,630 | $13,610 | $55,020 |
| 2016 | $3,691 | $64,880 | $13,610 | $51,270 |
| 2015 | $3,709 | $64,880 | $13,610 | $51,270 |
| 2014 | $3,686 | $64,880 | $13,610 | $51,270 |
| 2013 | $3,724 | $65,150 | $13,610 | $51,540 |
Source: Public Records
Map
Nearby Homes
- 8618 Turnstone Cir NW
- 8470 Shadyview Ave NW
- 5796 Starview Dr
- 7428 Shadyview Ave NW
- 8529 Morrilton Cir NW
- 8069 Orchardway St NW
- 0 S Arlington Rd Unit 4494606
- 6407 Southview Dr
- 9754 Agate St NW
- 8257 Akron Ave NW
- 0 W Comet Rd Unit 5079117
- 7622 Greenview Ave NW
- 5766 Weaver Rd
- 9007 Greensway St NW
- 8971 Greensway St NW
- 9015 Greensway St NW
- 8983 Greensway St NW
- 8955 Greensway St NW
- 7651 Brownwood Ave NW
- 0 Putter Ave NW
- 454 Stoner Rd
- 6744 Cedar Ridge Trail
- 6754 Cedar Ridge Trail
- 0 18 Cedar Ridge
- 444 Stoner Rd
- 6764 Cedar Ridge Trail
- 434 Stoner Rd
- 6743 Cedar Ridge Trail
- 6792 Cedar Ridge Trail
- 6144 Sierra Trail
- 6753 Cedar Ridge Trail
- 6763 Cedar Ridge Trail
- 530 Stoner Rd
- 422 Stoner Rd Unit 424
- 6806 Cedar Ridge Trail
- 6161 Sierra Trail
- 630 Hunter Hills Dr
- 6211 Caribou Dr
- 381 Stoner Rd
- 540 Stoner Rd
Your Personal Tour Guide
Ask me questions while you tour the home.