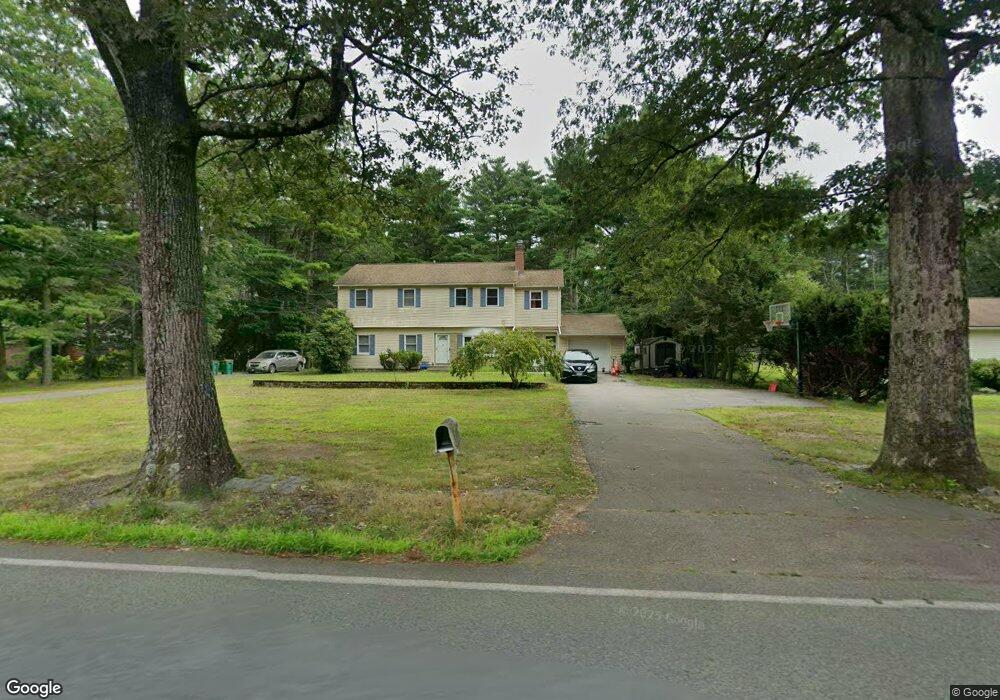
466 Williams St Mansfield, MA 02048
Estimated Value: $798,000 - $956,000
6
Beds
3
Baths
3,000
Sq Ft
$284/Sq Ft
Est. Value
About This Home
This home is located at 466 Williams St, Mansfield, MA 02048 and is currently estimated at $852,319, approximately $284 per square foot. 466 Williams St is a home located in Bristol County with nearby schools including Everett W. Robinson Elementary School, Jordan/Jackson Elementary School, and Harold L. Qualters Middle School.
Ownership History
Date
Name
Owned For
Owner Type
Purchase Details
Closed on
Oct 25, 2023
Sold by
Baskin Fred D
Bought by
Baskin Rt and Baskin
Current Estimated Value
Purchase Details
Closed on
Apr 28, 2010
Sold by
Medeiros Rose
Bought by
Baskin Fred
Home Financials for this Owner
Home Financials are based on the most recent Mortgage that was taken out on this home.
Original Mortgage
$335,775
Interest Rate
4.99%
Mortgage Type
Purchase Money Mortgage
Create a Home Valuation Report for This Property
The Home Valuation Report is an in-depth analysis detailing your home's value as well as a comparison with similar homes in the area
Home Values in the Area
Average Home Value in this Area
Purchase History
| Date | Buyer | Sale Price | Title Company |
|---|---|---|---|
| Baskin Rt | -- | None Available | |
| Baskin Fred | $393,000 | -- |
Source: Public Records
Mortgage History
| Date | Status | Borrower | Loan Amount |
|---|---|---|---|
| Previous Owner | Baskin Fred | $335,775 |
Source: Public Records
Tax History
| Year | Tax Paid | Tax Assessment Tax Assessment Total Assessment is a certain percentage of the fair market value that is determined by local assessors to be the total taxable value of land and additions on the property. | Land | Improvement |
|---|---|---|---|---|
| 2025 | $8,883 | $674,500 | $253,500 | $421,000 |
| 2024 | $8,554 | $633,600 | $253,500 | $380,100 |
| 2023 | $8,257 | $586,000 | $253,500 | $332,500 |
| 2022 | $7,910 | $521,400 | $234,800 | $286,600 |
| 2021 | $7,660 | $498,700 | $205,400 | $293,300 |
| 2020 | $7,391 | $481,200 | $195,600 | $285,600 |
| 2019 | $6,866 | $451,100 | $162,900 | $288,200 |
| 2018 | $6,829 | $438,600 | $155,500 | $283,100 |
| 2017 | $6,406 | $426,500 | $151,200 | $275,300 |
| 2016 | $6,141 | $398,500 | $143,700 | $254,800 |
| 2015 | $5,978 | $385,700 | $143,700 | $242,000 |
Source: Public Records
Map
Nearby Homes
- 24 Maverick Dr
- 85 Jewell St
- 78 Old Farm Rd
- 150 Gilbert St
- 14 Claire Ave
- 9 Coach Rd
- 116 George St
- 16 Treasure Island Rd
- 52 White Oak Way
- 115 Westfield Dr
- 57 Vine St
- 46 Mirimichi St
- 28 Messenger St
- 9 Oak Dr
- 49 Pheasant Hill Rd
- 2 Oak St Unit 2A
- 2 Oak St Unit 2B
- 451R Gilbert St
- Lot 5 Jeffrey Dr
- Lot 2 Jeffrey Dr