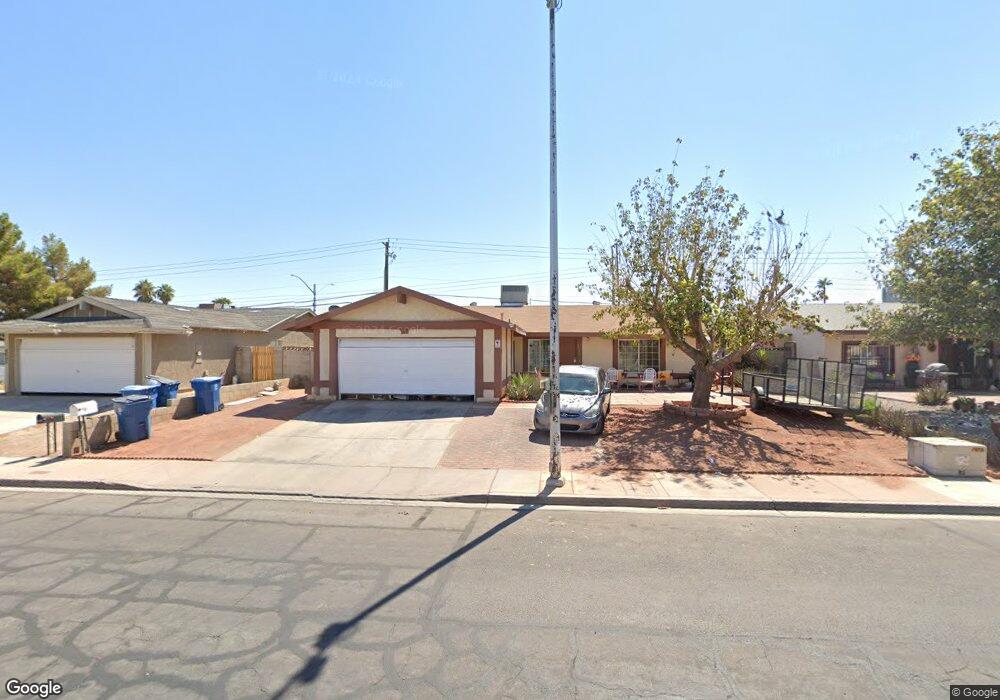
4661 Metpark Dr Las Vegas, NV 89110
East Las Vegas NeighborhoodEstimated Value: $344,062 - $368,000
4
Beds
2
Baths
1,248
Sq Ft
$284/Sq Ft
Est. Value
About This Home
This home is located at 4661 Metpark Dr, Las Vegas, NV 89110 and is currently estimated at $355,016, approximately $284 per square foot. 4661 Metpark Dr is a home located in Clark County with nearby schools including Elbert Edwards Elementary School, Dell H Robison Middle School, and Eldorado High School.
Ownership History
Date
Name
Owned For
Owner Type
Purchase Details
Closed on
Dec 30, 2002
Sold by
Xique Josefina
Bought by
Xique Concepcion
Current Estimated Value
Purchase Details
Closed on
Dec 26, 2002
Sold by
Xiqui Concepcion and Xiqui Sergio
Bought by
Xiqui Concepcion and Xiqui Isaac
Purchase Details
Closed on
Nov 28, 2000
Sold by
Unlimited Holdings Inc
Bought by
Xiqui Concepcion and Xiqui Sergio
Home Financials for this Owner
Home Financials are based on the most recent Mortgage that was taken out on this home.
Original Mortgage
$114,723
Outstanding Balance
$42,763
Interest Rate
7.86%
Mortgage Type
FHA
Estimated Equity
$312,253
Purchase Details
Closed on
May 19, 2000
Sold by
Huff Patrick
Bought by
Unlimited Holdings Inc
Purchase Details
Closed on
Nov 21, 1997
Sold by
Huff Patrick
Bought by
Huff Patrick
Create a Home Valuation Report for This Property
The Home Valuation Report is an in-depth analysis detailing your home's value as well as a comparison with similar homes in the area
Home Values in the Area
Average Home Value in this Area
Purchase History
| Date | Buyer | Sale Price | Title Company |
|---|---|---|---|
| Xique Concepcion | -- | First American Title Co | |
| Xiqui Concepcion | -- | First American Title Co | |
| Xiqui Concepcion | $114,900 | Lawyers Title | |
| Unlimited Holdings Inc | $64,000 | Stewart Title | |
| Huff Patrick | -- | Lawyers Title |
Source: Public Records
Mortgage History
| Date | Status | Borrower | Loan Amount |
|---|---|---|---|
| Open | Xiqui Concepcion | $114,723 |
Source: Public Records
Tax History Compared to Growth
Tax History
| Year | Tax Paid | Tax Assessment Tax Assessment Total Assessment is a certain percentage of the fair market value that is determined by local assessors to be the total taxable value of land and additions on the property. | Land | Improvement |
|---|---|---|---|---|
| 2025 | $922 | $47,686 | $24,150 | $23,536 |
| 2024 | $896 | $47,686 | $24,150 | $23,536 |
| 2023 | $896 | $49,898 | $26,600 | $23,298 |
| 2022 | $912 | $44,484 | $22,750 | $21,734 |
| 2021 | $844 | $42,061 | $21,000 | $21,061 |
| 2020 | $781 | $40,515 | $19,250 | $21,265 |
| 2019 | $732 | $37,093 | $15,750 | $21,343 |
| 2018 | $699 | $34,136 | $13,300 | $20,836 |
| 2017 | $1,103 | $33,638 | $12,250 | $21,388 |
| 2016 | $655 | $29,181 | $7,000 | $22,181 |
| 2015 | $653 | $26,702 | $5,600 | $21,102 |
| 2014 | $632 | $19,682 | $4,200 | $15,482 |
Source: Public Records
Map
Nearby Homes
- 4632 Shoen Ave
- 4649 Cuva Ct Unit 4
- 4705 Elm Ave
- 416 Martha St
- 409 Marion Dr
- 132 Hillsway Dr
- 158 Palisade Ave
- 500 Prescott St
- 4436 E Ogden Ave
- 45 Logan Ct
- 4428 Ash Ave
- 420 Greenbrook St
- 4437 Isabella Ave
- 4928 Ronan Dr
- 4533 Diamond Head Dr
- 408 Rhoda St
- 11 Page St
- 4709 Mahogany Dr
- 4424 Sunrise Ave
- 567 Roxella Ln Unit D