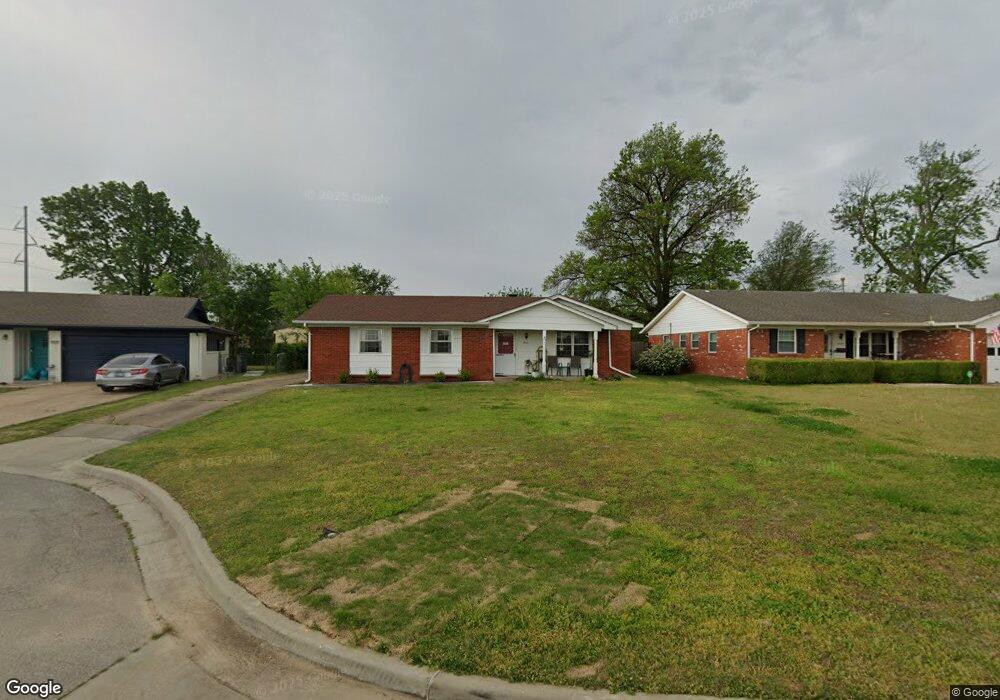
4661 S 88th Ave E Tulsa, OK 74145
Stevenson NeighborhoodEstimated Value: $200,000 - $220,000
--
Bed
2
Baths
1,463
Sq Ft
$142/Sq Ft
Est. Value
About This Home
This home is located at 4661 S 88th Ave E, Tulsa, OK 74145 and is currently estimated at $207,623, approximately $141 per square foot. 4661 S 88th Ave E is a home located in Tulsa County with nearby schools including Salk Elementary School, Memorial Middle School, and Memorial High School.
Ownership History
Date
Name
Owned For
Owner Type
Purchase Details
Closed on
Apr 15, 2024
Sold by
Draves Ronald G
Bought by
Lawyer Ali and Carr William
Current Estimated Value
Home Financials for this Owner
Home Financials are based on the most recent Mortgage that was taken out on this home.
Original Mortgage
$172,800
Outstanding Balance
$170,149
Interest Rate
6.74%
Mortgage Type
New Conventional
Estimated Equity
$37,474
Purchase Details
Closed on
Apr 30, 2019
Sold by
Poil George D and Poil Zenaida A
Bought by
Draves Ronald G
Home Financials for this Owner
Home Financials are based on the most recent Mortgage that was taken out on this home.
Original Mortgage
$113,630
Interest Rate
4.3%
Mortgage Type
VA
Purchase Details
Closed on
Apr 9, 2008
Sold by
Yaunt Rita C and Laughlin Steven Glenn
Bought by
Poil George D and Poil Zenaida A
Home Financials for this Owner
Home Financials are based on the most recent Mortgage that was taken out on this home.
Original Mortgage
$97,231
Interest Rate
6.19%
Mortgage Type
FHA
Create a Home Valuation Report for This Property
The Home Valuation Report is an in-depth analysis detailing your home's value as well as a comparison with similar homes in the area
Home Values in the Area
Average Home Value in this Area
Purchase History
| Date | Buyer | Sale Price | Title Company |
|---|---|---|---|
| Lawyer Ali | $192,000 | Residential Title & Escrow | |
| Draves Ronald G | $110,000 | Executive Title & Escrow Llc | |
| Poil George D | $98,000 | Firstitle & Abstract Service |
Source: Public Records
Mortgage History
| Date | Status | Borrower | Loan Amount |
|---|---|---|---|
| Open | Lawyer Ali | $172,800 | |
| Previous Owner | Draves Ronald G | $113,630 | |
| Previous Owner | Poil George D | $97,231 |
Source: Public Records
Tax History Compared to Growth
Tax History
| Year | Tax Paid | Tax Assessment Tax Assessment Total Assessment is a certain percentage of the fair market value that is determined by local assessors to be the total taxable value of land and additions on the property. | Land | Improvement |
|---|---|---|---|---|
| 2024 | $1,409 | $11,100 | $1,839 | $9,261 |
| 2023 | $1,409 | $11,100 | $1,753 | $9,347 |
| 2022 | $1,480 | $11,100 | $2,225 | $8,875 |
| 2021 | $1,466 | $11,100 | $2,225 | $8,875 |
| 2020 | $1,446 | $11,100 | $2,225 | $8,875 |
| 2019 | $1,413 | $10,315 | $2,211 | $8,104 |
| 2018 | $1,388 | $10,103 | $2,165 | $7,938 |
| 2017 | $1,341 | $10,780 | $2,310 | $8,470 |
| 2016 | $1,313 | $10,780 | $2,310 | $8,470 |
| 2015 | $1,316 | $10,780 | $2,310 | $8,470 |
| 2014 | $1,303 | $10,780 | $2,310 | $8,470 |
Source: Public Records
Map
Nearby Homes
- 4811 S 89th East Place
- 4615 S 85th Ave E
- 4722 S 85th East Ave
- 4862 S 87th East Ave
- 9124 E 49th St
- 9302 E 48th St
- 9409 E 49th St
- 3944 S 93rd East Ave
- 3860 S 82nd East Ave
- 7912 E 53rd St
- 3824 S 82nd East Ave
- 9126 E 38th St
- 9407 E 39th St
- 9123 E 38th St
- 3856 S 99th East Ave
- 3850 S 99th East Ave
- 3829 S 99th Ave E
- 5616 S 91st East Ave
- 9012 E 37th St
- 5605 S 95th East Ave
- 4661 S 88th East Ave
- 4665 S 88th East Ave
- 4655 S 88th East Ave
- 8735 E 47th Place
- 8729 E 47th Place
- 4671 S 88th East Ave
- 8725 E 47th Place
- 4651 S 88th Ave E
- 4651 S 88th East Ave
- 8741 E 47th Place
- 4656 S 88th East Ave
- 8719 E 47th Place
- 4645 S 88th East Ave
- 4666 S 88th East Ave
- 4675 S 88th East Ave
- 4676 S 88th East Ave
- 8745 E 47th Place
- 4641 S 88th East Ave
- 8715 E 47th Place
- 4672 S 88th East Ave