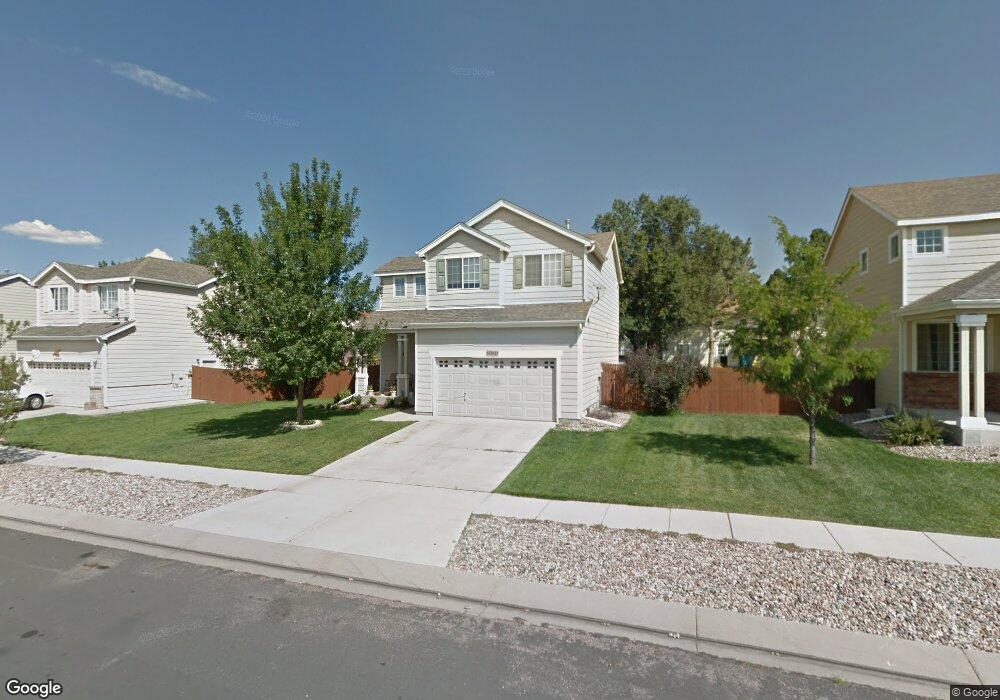
4662 Canyon Wren Ln Colorado Springs, CO 80916
Eastborough NeighborhoodEstimated Value: $376,000 - $394,000
3
Beds
3
Baths
1,439
Sq Ft
$268/Sq Ft
Est. Value
About This Home
This home is located at 4662 Canyon Wren Ln, Colorado Springs, CO 80916 and is currently estimated at $386,232, approximately $268 per square foot. 4662 Canyon Wren Ln is a home located in El Paso County with nearby schools including Jack Swigert Aerospace Academy, Mitchell High School, and Roosevelt Edison Charter School.
Ownership History
Date
Name
Owned For
Owner Type
Purchase Details
Closed on
Dec 3, 2021
Sold by
Inge Jason
Bought by
Rosales Jose L and Hodges Clara S
Current Estimated Value
Home Financials for this Owner
Home Financials are based on the most recent Mortgage that was taken out on this home.
Original Mortgage
$347,922
Outstanding Balance
$320,125
Interest Rate
3.14%
Mortgage Type
VA
Estimated Equity
$66,107
Purchase Details
Closed on
Feb 28, 2008
Sold by
Ambroso Curt A and Ambroso Alicia A
Bought by
Inge Jason
Home Financials for this Owner
Home Financials are based on the most recent Mortgage that was taken out on this home.
Original Mortgage
$173,552
Interest Rate
5.47%
Mortgage Type
VA
Purchase Details
Closed on
Feb 6, 2002
Sold by
Richmond American Homes Of Colorado Inc
Bought by
Ambroso Curt A and Ambroso Alicia A
Home Financials for this Owner
Home Financials are based on the most recent Mortgage that was taken out on this home.
Original Mortgage
$147,682
Interest Rate
7.12%
Mortgage Type
FHA
Create a Home Valuation Report for This Property
The Home Valuation Report is an in-depth analysis detailing your home's value as well as a comparison with similar homes in the area
Home Values in the Area
Average Home Value in this Area
Purchase History
| Date | Buyer | Sale Price | Title Company |
|---|---|---|---|
| Rosales Jose L | $340,100 | Heritage Title Company | |
| Inge Jason | $169,900 | Title America | |
| Ambroso Curt A | $150,000 | Stewart Title |
Source: Public Records
Mortgage History
| Date | Status | Borrower | Loan Amount |
|---|---|---|---|
| Open | Rosales Jose L | $347,922 | |
| Previous Owner | Inge Jason | $173,552 | |
| Previous Owner | Ambroso Curt A | $147,682 |
Source: Public Records
Tax History Compared to Growth
Tax History
| Year | Tax Paid | Tax Assessment Tax Assessment Total Assessment is a certain percentage of the fair market value that is determined by local assessors to be the total taxable value of land and additions on the property. | Land | Improvement |
|---|---|---|---|---|
| 2025 | $1,200 | $25,590 | -- | -- |
| 2024 | $1,089 | $26,010 | $4,090 | $21,920 |
| 2023 | $1,089 | $26,010 | $4,090 | $21,920 |
| 2022 | $1,058 | $18,910 | $3,600 | $15,310 |
| 2021 | $1,148 | $19,450 | $3,700 | $15,750 |
| 2020 | $967 | $14,250 | $2,880 | $11,370 |
| 2019 | $962 | $14,250 | $2,880 | $11,370 |
| 2018 | $845 | $11,510 | $2,120 | $9,390 |
| 2017 | $800 | $11,510 | $2,120 | $9,390 |
| 2016 | $669 | $11,540 | $2,190 | $9,350 |
| 2015 | $666 | $11,540 | $2,190 | $9,350 |
| 2014 | $643 | $10,690 | $2,190 | $8,500 |
Source: Public Records
Map
Nearby Homes
- 4569 Eastcrest Cir W
- 4675 Skylark Rd
- 4750 Wilde Dr
- 4704 Wilde Dr
- 4317 Dryden Dr
- 320 Vehr Dr
- 40 Murray Heights Dr
- 4415 E Pikes Peak Ave
- 529 Shady Crest Cir
- 116 S Murray Blvd
- 4216 Shelley Ave
- 562 Welsh Cir
- 392 Kitfield View Unit 179
- 4107 Keats Place
- 4535 Star Ridge Dr
- 4245 Kyle Ln
- 205 N Murray Blvd Unit 146
- 205 N Murray Blvd Unit 219
- 205 N Murray Blvd Unit 11
- 205 N Murray Blvd Unit 216
- 4674 Canyon Wren Ln
- 4656 Canyon Wren Ln
- 4611 Frost Dr
- 4615 Frost Dr
- 4607 Frost Dr
- 4667 Canyon Wren Ln
- 4661 Canyon Wren Ln
- 4680 Canyon Wren Ln
- 4650 Canyon Wren Ln
- 4673 Canyon Wren Ln
- 4619 Frost Dr
- 4531 Frost Dr
- 4655 Canyon Wren Ln
- 4649 Canyon Wren Ln
- 4623 Frost Dr
- 4692 Canyon Wren Ln
- 4644 Canyon Wren Ln
- 4584 Tetman Ln
- 4685 Canyon Wren Ln
- 4612 Tetman Ln