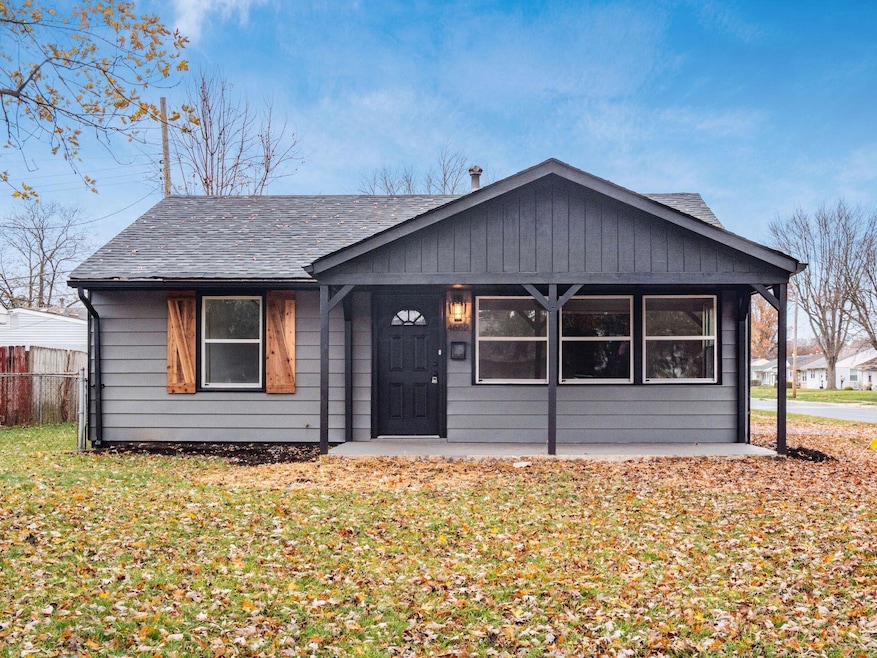
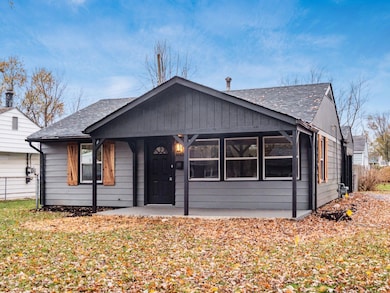
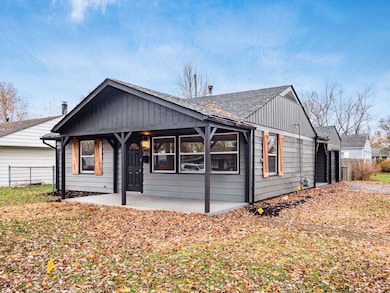
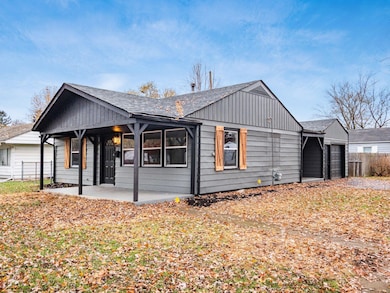
4662 Jae Ave Columbus, OH 43213
Estimated payment $1,413/month
Highlights
- Ranch Style House
- 1 Car Attached Garage
- Central Air
- No HOA
About This Home
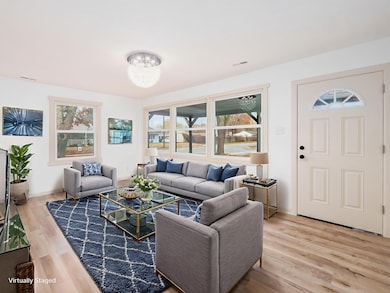
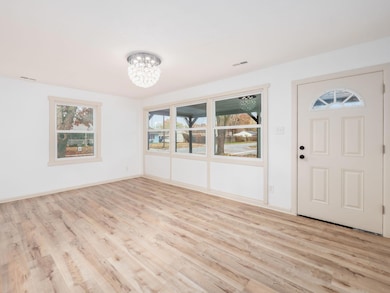
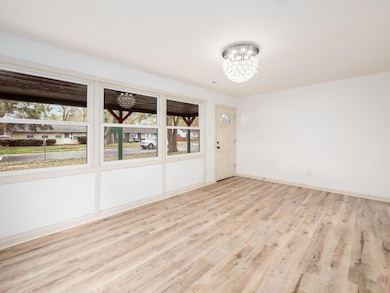
Beautifully remodeled ranch home in Whitehall School District. Tastefully updated throughout, offering 3 bedrooms, 1.5 bath and 1 car garage. Fresh paint, new flooring, new kitchen with stainless steel appliances and quartz, remodeled bathrooms with modern wooden vanities, floor to ceiling tile, contemporary lighting and much more. Easy to see and move in ready.
Home Details
Home Type
- Single Family
Est. Annual Taxes
- $2,165
Year Built
- Built in 1954
Parking
- 1 Car Attached Garage
- Garage Door Opener
- Off-Street Parking: 2
Home Design
- Ranch Style House
- Slab Foundation
Interior Spaces
- 1,092 Sq Ft Home
- Insulated Windows
Bedrooms and Bathrooms
- 3 Main Level Bedrooms
Additional Features
- 6,098 Sq Ft Lot
- Central Air
Community Details
- No Home Owners Association
Listing and Financial Details
- Assessor Parcel Number 090-002450
Map
Home Values in the Area
Average Home Value in this Area
Tax History
| Year | Tax Paid | Tax Assessment Tax Assessment Total Assessment is a certain percentage of the fair market value that is determined by local assessors to be the total taxable value of land and additions on the property. | Land | Improvement |
|---|---|---|---|---|
| 2025 | $5,083 | $49,530 | $12,220 | $37,310 |
| 2024 | $5,083 | $49,530 | $12,220 | $37,310 |
| 2023 | $2,150 | $49,525 | $12,215 | $37,310 |
| 2022 | $1,721 | $30,140 | $6,020 | $24,120 |
| 2021 | $1,616 | $30,140 | $6,020 | $24,120 |
| 2020 | $1,600 | $30,140 | $6,020 | $24,120 |
| 2019 | $1,462 | $23,940 | $4,830 | $19,110 |
| 2018 | $1,402 | $23,940 | $4,830 | $19,110 |
| 2017 | $1,412 | $23,940 | $4,830 | $19,110 |
| 2016 | $1,303 | $19,950 | $4,550 | $15,400 |
| 2015 | $1,314 | $19,950 | $4,550 | $15,400 |
| 2014 | $1,314 | $19,950 | $4,550 | $15,400 |
| 2013 | $694 | $22,155 | $5,040 | $17,115 |
Property History
| Date | Event | Price | List to Sale | Price per Sq Ft |
|---|---|---|---|---|
| 02/13/2026 02/13/26 | For Sale | $239,300 | 0.0% | $219 / Sq Ft |
| 02/10/2026 02/10/26 | Off Market | $239,300 | -- | -- |
| 02/05/2026 02/05/26 | Price Changed | $239,300 | 0.0% | $219 / Sq Ft |
| 01/29/2026 01/29/26 | Price Changed | $239,400 | 0.0% | $219 / Sq Ft |
| 01/22/2026 01/22/26 | Price Changed | $239,500 | 0.0% | $219 / Sq Ft |
| 01/15/2026 01/15/26 | Price Changed | $239,600 | 0.0% | $219 / Sq Ft |
| 12/18/2025 12/18/25 | Price Changed | $239,700 | 0.0% | $220 / Sq Ft |
| 12/11/2025 12/11/25 | Price Changed | $239,800 | 0.0% | $220 / Sq Ft |
| 11/21/2025 11/21/25 | For Sale | $239,900 | -- | $220 / Sq Ft |
Purchase History
| Date | Type | Sale Price | Title Company |
|---|---|---|---|
| Warranty Deed | -- | Pm Title | |
| Interfamily Deed Transfer | -- | None Available | |
| Warranty Deed | $75,000 | New Century | |
| Certificate Of Transfer | -- | -- | |
| Deed | -- | -- |
Mortgage History
| Date | Status | Loan Amount | Loan Type |
|---|---|---|---|
| Previous Owner | $63,750 | Fannie Mae Freddie Mac |
Source: Columbus and Central Ohio Regional MLS
MLS Number: 225043856
APN: 090-002450
Disclaimer: Certain information contained herein is derived from information provided by parties other than Homes.com. All information provided is deemed reliable, but is not guaranteed to be accurate and should be independently verified.
![]() IDX information is provided exclusively for personal, non-commercial use, and may not be used for any purpose other than to identify prospective properties consumers may be interested in purchasing.
IDX information is provided exclusively for personal, non-commercial use, and may not be used for any purpose other than to identify prospective properties consumers may be interested in purchasing.
Information is deemed reliable but not guaranteed.
- 706 Ross Rd
- 845 Exeter Rd
- 431 Cumberland Dr
- 491 Westphal Ave
- 745 Pierce Ave
- 1085 S Hamilton Rd
- 547 Country Club Rd
- 4481 Chandler Dr
- 695 Erickson Ave
- 931 Antwerp Rd
- 4413 Broadhurst Dr
- 798 S Yearling Rd
- 1193 Marble Dr
- 4517 Saint Rita Ln
- 963 Erickson Ave
- 4174 Wright Park
- 4991 Justin Rd
- 1229 Simpson Dr
- 4212 Seigman Ave
- 1284 Thurston Dr
- 4669 E Main St
- 1131 Lockwood Rd
- 280 Barkley Place W
- 4403 E Mound St
- 4517 San Jose Ln
- 1070 Irongate Ln
- 1250 Kelburn Rd
- 4657 E Broad St
- 3974 Andrus Ave
- 5312 Gatehouse Dr
- 4470 E Broad St
- 4264 E Broad St
- 3855 E Mound St
- 1462 Elaine Rd
- 5680 Hibernia Dr
- 1310 Easthill Dr
- 5354 Deerbrook Ln
- 156 Collingwood Ave
- 65 Robinwood Ave
- 215 Prairiecreek Way

Ask me questions while you tour the home.