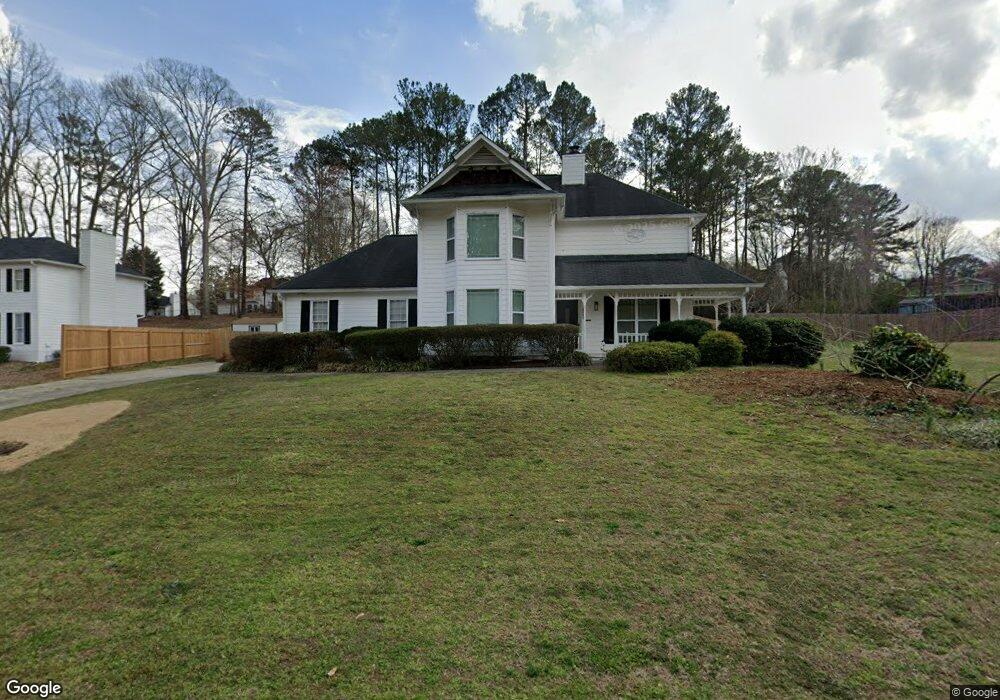
4662 Oconnor Way SE Unit 19 Mableton, GA 30126
Estimated Value: $380,111 - $442,000
3
Beds
3
Baths
1,856
Sq Ft
$218/Sq Ft
Est. Value
About This Home
This home is located at 4662 Oconnor Way SE Unit 19, Mableton, GA 30126 and is currently estimated at $404,778, approximately $218 per square foot. 4662 Oconnor Way SE Unit 19 is a home located in Cobb County with nearby schools including Mableton Elementary School, Floyd Middle School, and Covered Bridge Academy.
Ownership History
Date
Name
Owned For
Owner Type
Purchase Details
Closed on
May 11, 2018
Sold by
Arnold Nathaniel T
Bought by
Ruiz Justin and Ruiz Reiko
Current Estimated Value
Home Financials for this Owner
Home Financials are based on the most recent Mortgage that was taken out on this home.
Original Mortgage
$200,000
Outstanding Balance
$171,837
Interest Rate
4.4%
Mortgage Type
New Conventional
Estimated Equity
$232,941
Purchase Details
Closed on
May 19, 2017
Sold by
Roberts Christopher M
Bought by
Arnold Nathaniel T
Home Financials for this Owner
Home Financials are based on the most recent Mortgage that was taken out on this home.
Original Mortgage
$237,500
Interest Rate
3.97%
Mortgage Type
New Conventional
Purchase Details
Closed on
Apr 25, 2007
Sold by
Tanner Sarah W
Bought by
Roberts Chris M
Home Financials for this Owner
Home Financials are based on the most recent Mortgage that was taken out on this home.
Original Mortgage
$45,780
Interest Rate
6.11%
Mortgage Type
Stand Alone Refi Refinance Of Original Loan
Create a Home Valuation Report for This Property
The Home Valuation Report is an in-depth analysis detailing your home's value as well as a comparison with similar homes in the area
Home Values in the Area
Average Home Value in this Area
Purchase History
| Date | Buyer | Sale Price | Title Company |
|---|---|---|---|
| Ruiz Justin | $255,500 | -- | |
| Arnold Nathaniel T | $250,000 | -- | |
| Roberts Chris M | $228,900 | -- |
Source: Public Records
Mortgage History
| Date | Status | Borrower | Loan Amount |
|---|---|---|---|
| Open | Ruiz Justin | $200,000 | |
| Previous Owner | Arnold Nathaniel T | $237,500 | |
| Previous Owner | Roberts Chris M | $45,780 |
Source: Public Records
Tax History Compared to Growth
Tax History
| Year | Tax Paid | Tax Assessment Tax Assessment Total Assessment is a certain percentage of the fair market value that is determined by local assessors to be the total taxable value of land and additions on the property. | Land | Improvement |
|---|---|---|---|---|
| 2025 | $3,674 | $143,464 | $30,000 | $113,464 |
| 2024 | $3,466 | $133,768 | $28,000 | $105,768 |
| 2023 | $2,924 | $133,768 | $28,000 | $105,768 |
| 2022 | $3,287 | $124,460 | $24,000 | $100,460 |
| 2021 | $2,830 | $103,544 | $22,000 | $81,544 |
| 2020 | $2,813 | $102,796 | $22,000 | $80,796 |
| 2019 | $3,001 | $98,896 | $20,000 | $78,896 |
| 2018 | $3,001 | $98,896 | $20,000 | $78,896 |
| 2017 | $1,921 | $76,280 | $18,000 | $58,280 |
| 2016 | $1,923 | $76,280 | $18,000 | $58,280 |
| 2015 | $1,814 | $70,400 | $16,000 | $54,400 |
| 2014 | $1,570 | $61,664 | $0 | $0 |
Source: Public Records
Map
Nearby Homes
- 35 Dunaire Ct SW
- 221 Shady Ln SW
- 26 Flint Ridge Dr SE
- 4800 Timberland Dr SW
- 51 Queen Anne Dr SE
- 4724 Warrior Way SE Unit II
- 188 Covered Bridge Trail SW
- 4875 Millen Dr SE
- 0 Nickajack Rd SE Unit 7594642
- 450 Dorset Way SW
- 647 Shannon Green Cir SW
- 4094 Norton Place SE
- 5020 Hickory Mill Dr SE
- 71 Anita Place SE
- 187 Fontaine Rd SW
- 4025 Benell Ct SE
- 4246 Antler Trail SE
- 4662 Oconnor Way SE
- 4662 O'Connor Way
- 4658 Oconnor Way SE
- 4663 Oconnor Way SE
- 4663 O'Connor Way
- 4661 Oconnor Way SE
- 0 O'Connor Way Unit 8728424
- 0 O'Connor Way
- O O'Connor Way
- 4769 Brent Ct SE
- 4666 Oconnor Way SE
- 103 Shane Way SE
- 4767 Brent Ct SE
- 4665 Oconnor Way SE
- 4655 Oconnor Way SE
- 4667 Oconnor Way SE
- 4771 Brent Ct SE
- 100 Shane Way SE
- 4703 Crest Knoll Dr SE