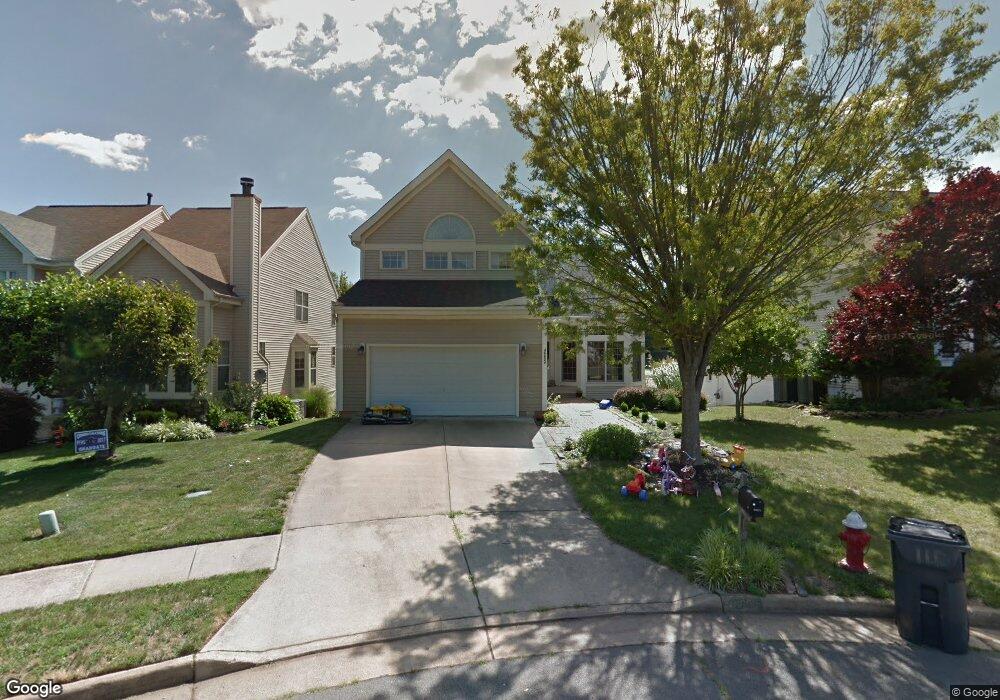
46624 Stonehelm Ct Sterling, VA 20165
Estimated Value: $871,190 - $951,000
4
Beds
4
Baths
3,461
Sq Ft
$261/Sq Ft
Est. Value
About This Home
This home is located at 46624 Stonehelm Ct, Sterling, VA 20165 and is currently estimated at $905,048, approximately $261 per square foot. 46624 Stonehelm Ct is a home located in Loudoun County with nearby schools including Potowmack Elementary School, River Bend Middle School, and Potomac Falls High School.
Ownership History
Date
Name
Owned For
Owner Type
Purchase Details
Closed on
Jan 28, 2011
Sold by
Jackley Kim E
Bought by
Shrestha Sudip
Current Estimated Value
Home Financials for this Owner
Home Financials are based on the most recent Mortgage that was taken out on this home.
Original Mortgage
$372,400
Outstanding Balance
$255,429
Interest Rate
4.83%
Mortgage Type
New Conventional
Estimated Equity
$649,619
Purchase Details
Closed on
Aug 25, 2006
Sold by
Devecchis James A
Bought by
Jackley Mark and Dailey,Kim E
Home Financials for this Owner
Home Financials are based on the most recent Mortgage that was taken out on this home.
Original Mortgage
$185,000
Interest Rate
6.83%
Mortgage Type
New Conventional
Purchase Details
Closed on
Sep 27, 1993
Sold by
Trafalgar House Prop
Bought by
Devecchis James A
Home Financials for this Owner
Home Financials are based on the most recent Mortgage that was taken out on this home.
Original Mortgage
$197,600
Interest Rate
7.1%
Create a Home Valuation Report for This Property
The Home Valuation Report is an in-depth analysis detailing your home's value as well as a comparison with similar homes in the area
Home Values in the Area
Average Home Value in this Area
Purchase History
| Date | Buyer | Sale Price | Title Company |
|---|---|---|---|
| Shrestha Sudip | $465,500 | -- | |
| Jackley Mark | $605,000 | -- | |
| Devecchis James A | $247,000 | -- |
Source: Public Records
Mortgage History
| Date | Status | Borrower | Loan Amount |
|---|---|---|---|
| Open | Shrestha Sudip | $372,400 | |
| Previous Owner | Jackley Mark | $185,000 | |
| Previous Owner | Devecchis James A | $197,600 |
Source: Public Records
Tax History Compared to Growth
Tax History
| Year | Tax Paid | Tax Assessment Tax Assessment Total Assessment is a certain percentage of the fair market value that is determined by local assessors to be the total taxable value of land and additions on the property. | Land | Improvement |
|---|---|---|---|---|
| 2025 | $6,887 | $855,560 | $254,000 | $601,560 |
| 2024 | $6,944 | $802,830 | $234,000 | $568,830 |
| 2023 | $6,916 | $790,360 | $234,000 | $556,360 |
| 2022 | $6,497 | $729,960 | $229,000 | $500,960 |
| 2021 | $6,299 | $642,710 | $207,000 | $435,710 |
| 2020 | $6,326 | $611,180 | $197,000 | $414,180 |
| 2019 | $6,139 | $587,420 | $197,000 | $390,420 |
| 2018 | $6,243 | $575,430 | $187,000 | $388,430 |
| 2017 | $6,242 | $554,830 | $187,000 | $367,830 |
| 2016 | $6,493 | $567,080 | $0 | $0 |
| 2015 | $6,159 | $355,630 | $0 | $355,630 |
| 2014 | $6,180 | $348,030 | $0 | $348,030 |
Source: Public Records
Map
Nearby Homes
- 46685 Joubert Terrace
- 46622 Drysdale Terrace Unit 100
- 46608 Drysdale Terrace Unit 101
- 20597 Glenmere Square
- 46606 Drysdale Terrace Unit 101
- 46675 Cavendish Square
- 20419 Riverbend Square Unit 202
- 20419 Riverbend Square Unit 301
- 20687 Smithfield Ct
- 20544 Morningside Terrace
- 110 Sugarland Run Dr
- 105 Woodgate Ct
- 20594 Shadow Woods Ct
- 6 Sugarland Square Ct
- 25 Jefferson Dr
- 20627 Cutwater Place
- 10 Crouch St
- 126 Hillsdale Dr
- 20970 Promontory Square
- 112 Argus Place
- 46620 Stonehelm Ct
- 46629 Stonehelm Ct
- 46616 Stonehelm Ct
- 46625 Stonehelm Ct
- 46612 Stonehelm Ct
- 46617 Stonehelm Ct
- 46591 Hollymead Place
- 46608 Stonehelm Ct
- 46621 Stonehelm Ct
- 46613 Stonehelm Ct
- 46587 Hollymead Place
- 46595 Hollymead Place
- 46604 Stonehelm Ct
- 46641 Joubert Terrace
- 46643 Joubert Terrace
- 46609 Stonehelm Ct
- 46583 Hollymead Place
- 46645 Joubert Terrace
- 46599 Hollymead Place
- 20519 Zolabeane Square