Estimated Value: $825,000 - $877,000
4
Beds
3
Baths
4,858
Sq Ft
$175/Sq Ft
Est. Value
About This Home
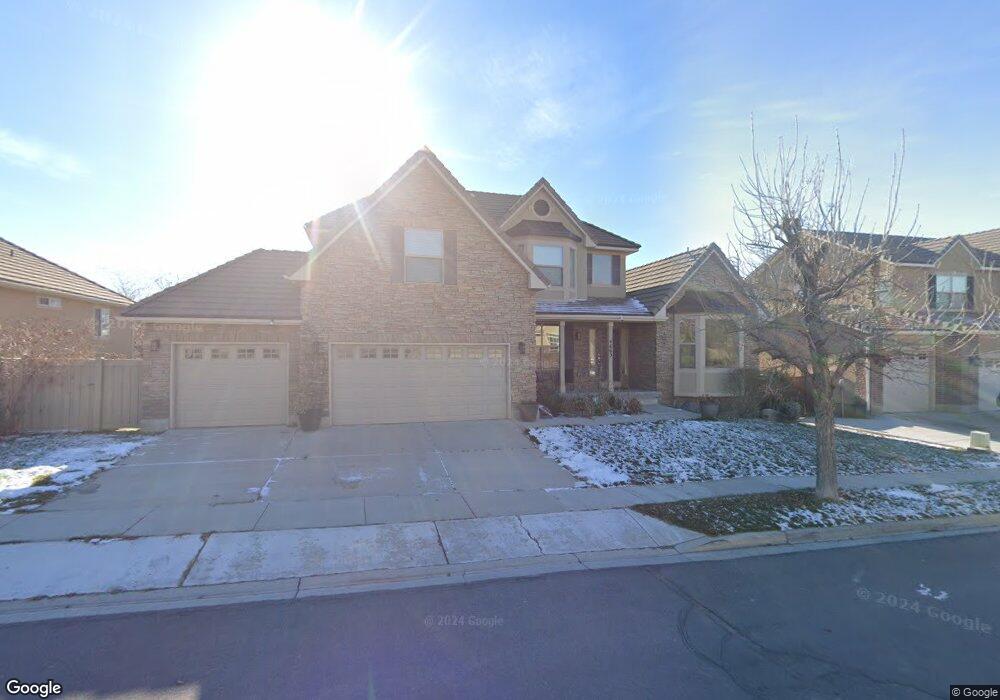
This home is located at 4665 N Pheasant Ridge Trail, Lehi, UT 84043 and is currently estimated at $851,687, approximately $175 per square foot. 4665 N Pheasant Ridge Trail is a home located in Utah County with nearby schools including Traverse Mountain Elementary School, Skyridge High School, and Ignite Entrepreneurship Academy.
Ownership History
Date
Name
Owned For
Owner Type
Purchase Details
Closed on
Feb 14, 2019
Sold by
Bydida Kranthi
Bought by
Bydida Kranthi and Kesireddy Arthi
Current Estimated Value
Home Financials for this Owner
Home Financials are based on the most recent Mortgage that was taken out on this home.
Original Mortgage
$471,000
Outstanding Balance
$414,093
Interest Rate
4.5%
Mortgage Type
New Conventional
Estimated Equity
$437,594
Purchase Details
Closed on
Apr 6, 2005
Sold by
Vanbuskirk Donald M
Bought by
Vanbuskirk Donald M and Vanbuskirk Van Buskirk
Create a Home Valuation Report for This Property
The Home Valuation Report is an in-depth analysis detailing your home's value as well as a comparison with similar homes in the area
Home Values in the Area
Average Home Value in this Area
Purchase History
| Date | Buyer | Sale Price | Title Company |
|---|---|---|---|
| Bydida Kranthi | -- | Accommodation | |
| Bydida Kranthi | -- | Meridian Title Company | |
| Vanbuskirk Donald M | -- | Timp Title Insurance Agency | |
| Vanbuskirk Donald M | -- | First American Title Co |
Source: Public Records
Mortgage History
| Date | Status | Borrower | Loan Amount |
|---|---|---|---|
| Open | Bydida Kranthi | $471,000 |
Source: Public Records
Tax History Compared to Growth
Tax History
| Year | Tax Paid | Tax Assessment Tax Assessment Total Assessment is a certain percentage of the fair market value that is determined by local assessors to be the total taxable value of land and additions on the property. | Land | Improvement |
|---|---|---|---|---|
| 2025 | $3,248 | $397,705 | $208,300 | $514,800 |
| 2024 | $3,248 | $380,160 | $0 | $0 |
| 2023 | $3,052 | $387,860 | $0 | $0 |
| 2022 | $2,956 | $364,155 | $0 | $0 |
| 2021 | $2,821 | $525,300 | $142,900 | $382,400 |
| 2020 | $2,660 | $489,700 | $132,300 | $357,400 |
| 2019 | $2,467 | $472,100 | $132,300 | $339,800 |
| 2018 | $2,522 | $456,200 | $128,900 | $327,300 |
| 2017 | $2,306 | $221,815 | $0 | $0 |
| 2016 | $2,444 | $218,130 | $0 | $0 |
| 2015 | $2,465 | $208,780 | $0 | $0 |
| 2014 | -- | $179,685 | $0 | $0 |
Source: Public Records
Map
Nearby Homes
- 4685 N Pheasant Ridge Trail
- 4665 N Stonehaven Loop
- 4852 N Arctic Fox Cir
- 2297 W New Harvest Ln
- 2082 Wild Rose Ct
- 4923 N Marble Fox Way Unit 124
- 4394 N Foxtrail Dr
- 4293 N Cresthaven Ln
- 4438 N Buckstone Way Unit 1088
- 4432 N Buckstone Way Unit 1087
- 4426 N Buckstone Way Unit 1086
- 4420 N Buckstone Way Unit 1085
- 4901 N Eagle Nest Ln
- 4205 N Cresthaven Ln
- 5034 N Marble Fox Way
- 5047 N Larkwood Ln
- 6197 N Fox Rd
- 4425 N Ridge View Way
- 4379 N Ridge View Way
- 5146 N Ravencrest Ln
- 4675 Pheasant Ridge Trail
- 4675 N Pheasant Ridge Trail
- 4655 N Pheasant Ridge Trail
- 2384 W Stonehaven Loop
- 2420 Stonehaven Loop
- 2420 W Stonehaven Loop
- 2374 W Stonehaven Loop
- 4694 N Pheasant Ridge Trail
- 4645 N Pheasant Ridge Trail
- 4682 N Pheasant Ridge Trail
- 4685 Pheasant Ridge Trail
- 4682 N Pheasant Ridge Trail
- 2438 Stonehaven Loop
- 2358 W Stonehaven Loop
- 4672 N Pheasant Ridge Trail
- 2365 W Pebblestone Ln
- 2365 Pebblestone Ln
- 2411 W Stonehaven Loop
- 4635 N Pheasant Ridge Trail
- 4635 Pheasant Ridge Trail