4666 N 800 E Andrews, IN 46702
Estimated Value: $184,000 - $372,000
3
Beds
2
Baths
1,200
Sq Ft
$221/Sq Ft
Est. Value
About This Home
This home is located at 4666 N 800 E, Andrews, IN 46702 and is currently estimated at $265,189, approximately $220 per square foot. 4666 N 800 E is a home.
Ownership History
Date
Name
Owned For
Owner Type
Purchase Details
Closed on
Jan 18, 2006
Sold by
Barton Daniel B
Bought by
Barton Daniel B and Barton Tiffany L
Current Estimated Value
Home Financials for this Owner
Home Financials are based on the most recent Mortgage that was taken out on this home.
Original Mortgage
$114,300
Interest Rate
6.42%
Mortgage Type
New Conventional
Create a Home Valuation Report for This Property
The Home Valuation Report is an in-depth analysis detailing your home's value as well as a comparison with similar homes in the area
Purchase History
| Date | Buyer | Sale Price | Title Company |
|---|---|---|---|
| Barton Daniel B | -- | -- |
Source: Public Records
Mortgage History
| Date | Status | Borrower | Loan Amount |
|---|---|---|---|
| Closed | Barton Daniel B | $114,300 |
Source: Public Records
Tax History
| Year | Tax Paid | Tax Assessment Tax Assessment Total Assessment is a certain percentage of the fair market value that is determined by local assessors to be the total taxable value of land and additions on the property. | Land | Improvement |
|---|---|---|---|---|
| 2025 | $749 | $159,400 | $19,600 | $139,800 |
| 2024 | $749 | $134,200 | $19,600 | $114,600 |
| 2023 | $773 | $128,100 | $19,600 | $108,500 |
| 2022 | $643 | $127,100 | $19,600 | $107,500 |
| 2021 | $536 | $109,200 | $17,100 | $92,100 |
| 2020 | $514 | $107,900 | $17,100 | $90,800 |
| 2019 | $403 | $94,600 | $17,100 | $77,500 |
| 2018 | $382 | $91,100 | $17,100 | $74,000 |
| 2017 | $376 | $88,700 | $17,500 | $71,200 |
| 2016 | $330 | $89,500 | $17,500 | $72,000 |
| 2014 | $276 | $87,300 | $17,500 | $69,800 |
| 2013 | $285 | $87,000 | $17,500 | $69,500 |
Source: Public Records
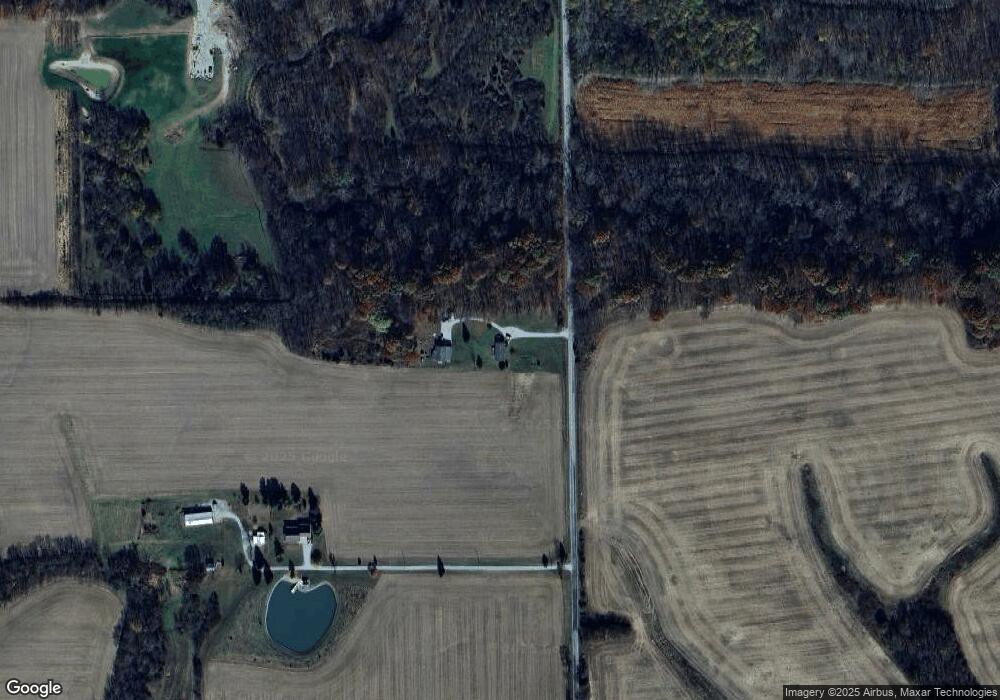
Map
Nearby Homes
- 4435 N 825 W
- 288 N Main St
- 519 W Mckeever St
- 172 N Main St
- 436 W Bellville Ave
- 109 S Market St
- 190 N State St
- 63 E Mckeever St
- 161 S Jackson St
- 6673 E Blue Star Hwy
- 6455 W 444 N
- 8707 W 800 N
- TBD 495 N
- 5562 W 100 N
- 4553 W 600 N
- 4497 W 200 N Unit 69
- 1913 Hunters Ridge Dr
- 3881 W 558 N
- 3010 Trappers Cove
- 5533 N 150 E
Your Personal Tour Guide
Ask me questions while you tour the home.