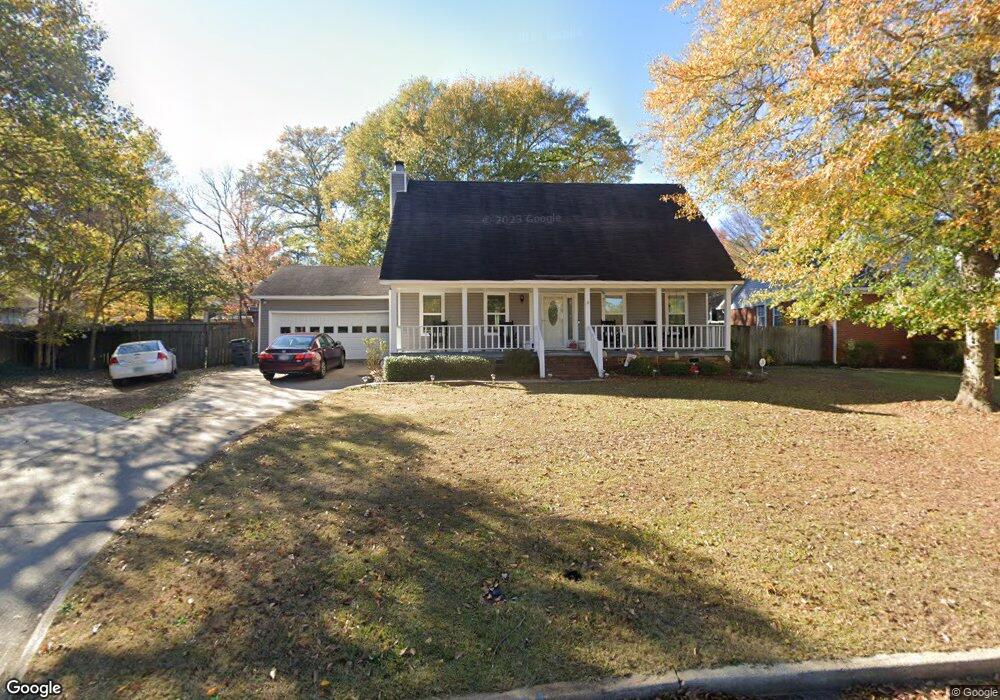
4666 Red Leaf Way Augusta, GA 30907
Estimated Value: $238,000 - $259,000
3
Beds
3
Baths
1,502
Sq Ft
$165/Sq Ft
Est. Value
About This Home
This home is located at 4666 Red Leaf Way, Augusta, GA 30907 and is currently estimated at $247,384, approximately $164 per square foot. 4666 Red Leaf Way is a home located in Columbia County with nearby schools including Westmont Elementary School, Columbia Middle School, and Evans High School.
Ownership History
Date
Name
Owned For
Owner Type
Purchase Details
Closed on
Apr 29, 2020
Sold by
Dobbs Johnny H
Bought by
Shanks Antonio Latron
Current Estimated Value
Home Financials for this Owner
Home Financials are based on the most recent Mortgage that was taken out on this home.
Original Mortgage
$140,409
Outstanding Balance
$124,596
Interest Rate
3.49%
Mortgage Type
FHA
Estimated Equity
$122,788
Purchase Details
Closed on
Jul 19, 2007
Sold by
Wilkie Lorraine
Bought by
Dobbs Johnny H
Home Financials for this Owner
Home Financials are based on the most recent Mortgage that was taken out on this home.
Original Mortgage
$144,728
Interest Rate
6.65%
Mortgage Type
FHA
Purchase Details
Closed on
Sep 24, 2002
Sold by
Fleming Michael P
Bought by
Wilkie Lorraine and Fleming Lorraine Lillie
Home Financials for this Owner
Home Financials are based on the most recent Mortgage that was taken out on this home.
Original Mortgage
$84,000
Interest Rate
6.27%
Create a Home Valuation Report for This Property
The Home Valuation Report is an in-depth analysis detailing your home's value as well as a comparison with similar homes in the area
Home Values in the Area
Average Home Value in this Area
Purchase History
| Date | Buyer | Sale Price | Title Company |
|---|---|---|---|
| Shanks Antonio Latron | $143,000 | -- | |
| Dobbs Johnny H | $147,000 | -- | |
| Wilkie Lorraine | -- | -- |
Source: Public Records
Mortgage History
| Date | Status | Borrower | Loan Amount |
|---|---|---|---|
| Open | Shanks Antonio Latron | $140,409 | |
| Previous Owner | Dobbs Johnny H | $144,728 | |
| Previous Owner | Wilkie Lorraine | $84,000 |
Source: Public Records
Tax History
| Year | Tax Paid | Tax Assessment Tax Assessment Total Assessment is a certain percentage of the fair market value that is determined by local assessors to be the total taxable value of land and additions on the property. | Land | Improvement |
|---|---|---|---|---|
| 2025 | $2,324 | $94,984 | $19,804 | $75,180 |
| 2024 | $2,377 | $92,772 | $18,404 | $74,368 |
| 2023 | $2,377 | $86,356 | $17,204 | $69,152 |
| 2022 | $2,062 | $77,091 | $16,004 | $61,087 |
| 2021 | $1,614 | $57,200 | $11,400 | $45,800 |
| 2020 | $1,814 | $63,230 | $12,804 | $50,426 |
| 2019 | $1,772 | $61,684 | $12,204 | $49,480 |
| 2018 | $1,690 | $58,557 | $11,404 | $47,153 |
| 2017 | $1,688 | $58,276 | $11,504 | $46,772 |
| 2016 | $1,542 | $55,031 | $11,080 | $43,951 |
| 2015 | $1,497 | $53,242 | $10,380 | $42,862 |
| 2014 | $1,473 | $51,700 | $9,580 | $42,120 |
Source: Public Records
Map
Nearby Homes
- 4680 Oakley Pirkle Rd
- 4608 Country Meadows Ln
- 289 Ashbrook Dr
- 4773 Maple Creek Ct
- 303 Meadowlake Dr
- 4755 Maple Spring Ct
- 409 Constitution Ave
- 319 Rockdale Rd
- 111 Sheldon Dr
- 4009 Waccamaw Dr
- 4660 Millhaven Rd
- 4621 Durbin Dr
- 4614 Durbin Dr
- 4613 Durbin Dr
- 1602 Baldwin Lakes Dr
- 3005 Saint James Place
- 1599 Baldwin Lakes Dr
- 133 Highview Dr
- 2037 Magnolia Pkwy
- 4777 Cold Springs Dr
- 4668 Red Leaf Way
- 153 Crawford Dr
- 4689 Crawford Ct
- 4691 Crawford Ct
- 4687 Crawford Ct
- 155 Crawford Dr
- 4670 Red Leaf Way
- 4665 Red Leaf Way
- 4663 Red Leaf Way
- 4693 Crawford Ct
- 154 Crawford Dr
- 4667 Red Leaf Way
- 4695 Crawford Ct
- 4672 Red Leaf Way
- 156 Crawford Dr
- 152 Crawford Dr
- 150 Crawford Dr
- 4669 Red Leaf Way
- 148 Crawford Dr
- 158 Crawford Dr
Your Personal Tour Guide
Ask me questions while you tour the home.