Estimated Value: $422,000 - $449,961
5
Beds
3
Baths
1,079
Sq Ft
$407/Sq Ft
Est. Value
About This Home
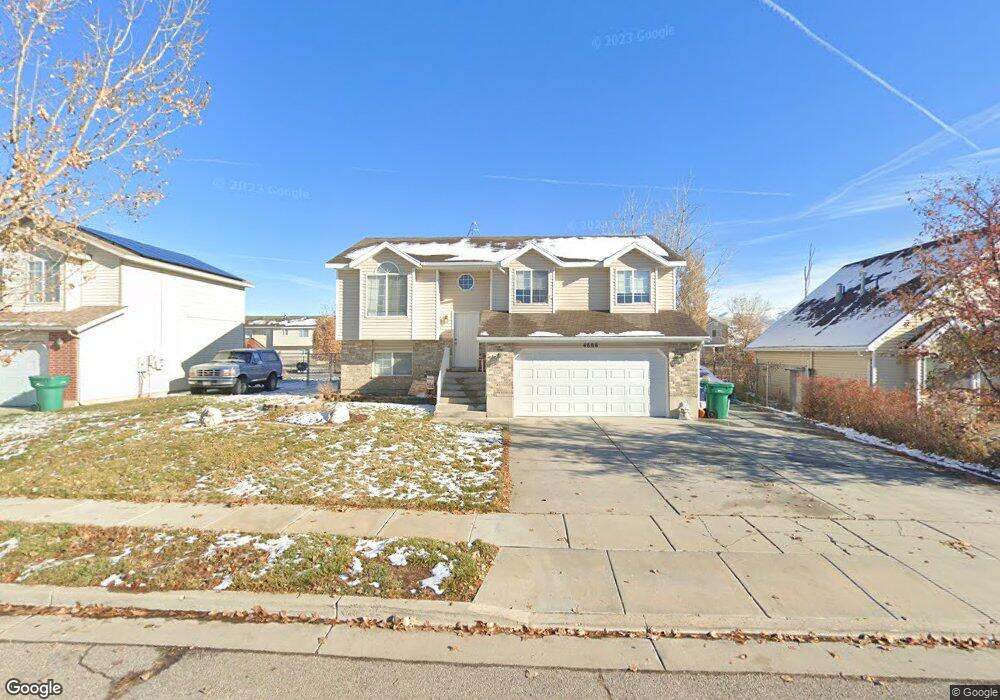
This home is located at 4666 S 4075 W Unit 31, Roy, UT 84067 and is currently estimated at $438,990, approximately $406 per square foot. 4666 S 4075 W Unit 31 is a home located in Weber County with nearby schools including West Haven School, Sand Ridge Junior High School, and Roy High School.
Ownership History
Date
Name
Owned For
Owner Type
Purchase Details
Closed on
Dec 3, 2012
Sold by
Garcia Nohemy
Bought by
Ah4r Ut Llc
Current Estimated Value
Purchase Details
Closed on
Apr 24, 2009
Sold by
Garcia Nohemy and Garcia Neomy
Bought by
Garcia Nohemy
Home Financials for this Owner
Home Financials are based on the most recent Mortgage that was taken out on this home.
Original Mortgage
$114,000
Interest Rate
4.99%
Mortgage Type
Stand Alone Refi Refinance Of Original Loan
Purchase Details
Closed on
Jan 18, 2008
Sold by
Garcia Aurelio
Bought by
Garcia Neomy
Purchase Details
Closed on
Jul 31, 2001
Sold by
Mike Schultz Construction Inc
Bought by
Garcia Aurelio
Home Financials for this Owner
Home Financials are based on the most recent Mortgage that was taken out on this home.
Original Mortgage
$133,406
Interest Rate
7.09%
Mortgage Type
Purchase Money Mortgage
Purchase Details
Closed on
Nov 29, 2000
Sold by
Tiffany Development Lc
Bought by
Mike Schultz Construction Inc
Create a Home Valuation Report for This Property
The Home Valuation Report is an in-depth analysis detailing your home's value as well as a comparison with similar homes in the area
Home Values in the Area
Average Home Value in this Area
Purchase History
| Date | Buyer | Sale Price | Title Company |
|---|---|---|---|
| Ah4r Ut Llc | -- | Inwest Title Ogden | |
| Garcia Nohemy | -- | Bonneville Superior Title Co | |
| Garcia Neomy | -- | None Available | |
| Garcia Aurelio | -- | -- | |
| Mike Schultz Construction Inc | -- | Bonneville Title Company |
Source: Public Records
Mortgage History
| Date | Status | Borrower | Loan Amount |
|---|---|---|---|
| Previous Owner | Garcia Nohemy | $114,000 | |
| Previous Owner | Garcia Aurelio | $133,406 |
Source: Public Records
Tax History
| Year | Tax Paid | Tax Assessment Tax Assessment Total Assessment is a certain percentage of the fair market value that is determined by local assessors to be the total taxable value of land and additions on the property. | Land | Improvement |
|---|---|---|---|---|
| 2025 | $2,753 | $452,875 | $130,015 | $322,860 |
| 2024 | $2,433 | $404,000 | $130,015 | $273,985 |
| 2023 | $2,323 | $387,000 | $124,980 | $262,020 |
| 2022 | $2,421 | $417,000 | $110,001 | $306,999 |
| 2021 | $1,961 | $309,000 | $79,963 | $229,037 |
| 2020 | $1,927 | $281,000 | $79,963 | $201,037 |
| 2019 | $1,802 | $246,000 | $49,906 | $196,094 |
| 2018 | $1,754 | $226,000 | $42,041 | $183,959 |
| 2017 | $1,627 | $196,000 | $42,041 | $153,959 |
| 2016 | $1,577 | $102,587 | $21,944 | $80,643 |
| 2015 | $1,422 | $94,377 | $21,944 | $72,433 |
| 2014 | $1,436 | $94,378 | $19,237 | $75,141 |
Source: Public Records
Map
Nearby Homes
- 4024 W 4650 S
- 4101 W 4600 S
- 4602 S 4000 W
- 3937 W 4650 S
- 4950 3900 West St
- 4813 S 3850 W
- 4853 S 4275 W Unit 27
- 4088 W 5050 S
- 4486 S 4300 W
- 4218 W 5050 S
- 4096 W 5075 S
- 5035 S 4275 W
- 4216 W 5250 S
- 4277 W 5250 S
- 3517 W 4835 S Unit 27
- 3610 W 4475 S
- 3509 W 4835 S Unit 26
- 4239 W 5325 S
- 5412 S 3925 W
- 3405 W 4525 S
- 4666 S 4075 W
- 4654 S 4075 W
- 4678 S 4075 W
- 4642 S 4075 W
- 4690 S 4075 W
- 4077 W 4650 S
- 4035 W 4650 S
- 4630 S 4075 W
- 4080 W 4700 S
- 4080 W 4700 S Unit 21
- 4702 S 4075 W
- 4702 S 4075 W Unit 28
- 4045 W 4650 S
- 4076 W 4650 S
- 4083 W 4650 S
- 4043 W 4700 S
- 4716 S 4075 W
- 4716 S 4075 W Unit 27
- 4618 S 4075 W
- 4618 S 4075 W Unit 35
Your Personal Tour Guide
Ask me questions while you tour the home.