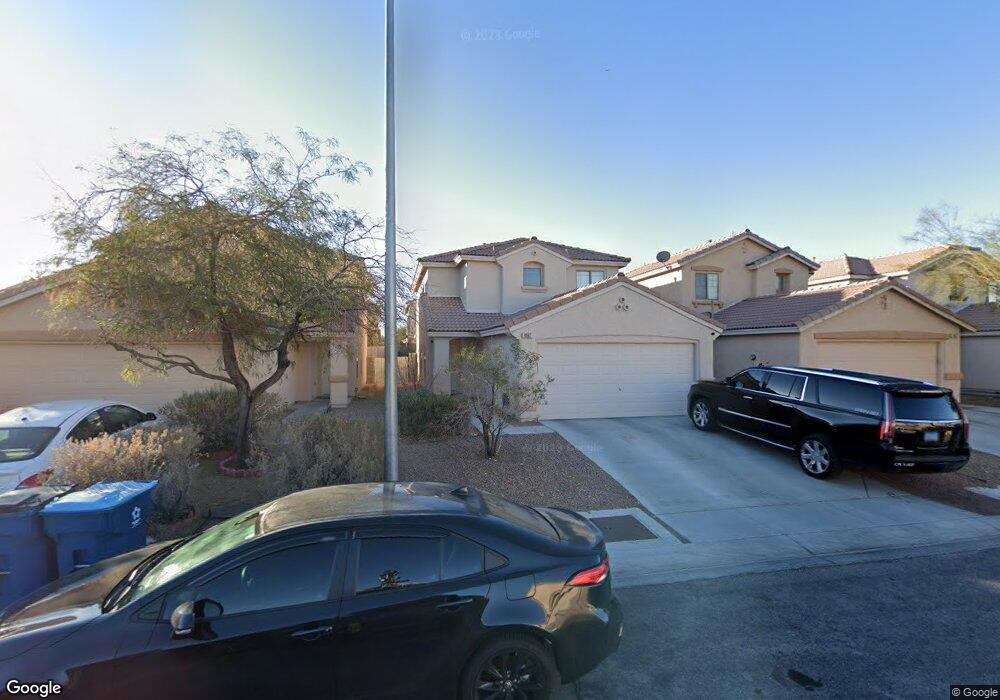
4667 Englewood Ave Las Vegas, NV 89139
Coronado Ranch NeighborhoodEstimated Value: $428,000 - $454,000
5
Beds
3
Baths
1,818
Sq Ft
$243/Sq Ft
Est. Value
About This Home
This home is located at 4667 Englewood Ave, Las Vegas, NV 89139 and is currently estimated at $441,800, approximately $243 per square foot. 4667 Englewood Ave is a home located in Clark County with nearby schools including Dr. Beverly S. Mathis Elementary School, Lawrence & Heidi Canarelli Middle School, and Desert Oasis High School.
Ownership History
Date
Name
Owned For
Owner Type
Purchase Details
Closed on
Jan 23, 2009
Sold by
Deutsche Bank National Trust Company
Bought by
Tesfamariam Seare G
Current Estimated Value
Home Financials for this Owner
Home Financials are based on the most recent Mortgage that was taken out on this home.
Original Mortgage
$147,283
Outstanding Balance
$92,597
Interest Rate
5.08%
Mortgage Type
FHA
Estimated Equity
$349,203
Purchase Details
Closed on
Jun 3, 2008
Sold by
Lee Jennifer H M and Lee Lambert L K
Bought by
Deutsche Bank National Trust Co and Registered Holders Of Ameriquest Mtg Sec
Purchase Details
Closed on
Feb 5, 2003
Sold by
Woodside Homes Of Nevada Inc
Bought by
Lee Lambert Lk and Lee Jennifer Hm
Home Financials for this Owner
Home Financials are based on the most recent Mortgage that was taken out on this home.
Original Mortgage
$169,200
Interest Rate
5.76%
Create a Home Valuation Report for This Property
The Home Valuation Report is an in-depth analysis detailing your home's value as well as a comparison with similar homes in the area
Home Values in the Area
Average Home Value in this Area
Purchase History
| Date | Buyer | Sale Price | Title Company |
|---|---|---|---|
| Tesfamariam Seare G | $150,000 | First American Title Paseo V | |
| Deutsche Bank National Trust Co | $246,875 | Accommodation | |
| Lee Lambert Lk | $178,125 | United Title Of Nevada |
Source: Public Records
Mortgage History
| Date | Status | Borrower | Loan Amount |
|---|---|---|---|
| Open | Tesfamariam Seare G | $147,283 | |
| Previous Owner | Lee Lambert Lk | $169,200 |
Source: Public Records
Tax History Compared to Growth
Tax History
| Year | Tax Paid | Tax Assessment Tax Assessment Total Assessment is a certain percentage of the fair market value that is determined by local assessors to be the total taxable value of land and additions on the property. | Land | Improvement |
|---|---|---|---|---|
| 2025 | $1,659 | $107,844 | $35,000 | $72,844 |
| 2024 | $1,611 | $107,844 | $35,000 | $72,844 |
| 2023 | $1,611 | $100,163 | $31,500 | $68,663 |
| 2022 | $1,564 | $88,965 | $26,250 | $62,715 |
| 2021 | $1,519 | $82,648 | $23,100 | $59,548 |
| 2020 | $1,471 | $80,358 | $21,350 | $59,008 |
| 2019 | $1,428 | $76,945 | $18,900 | $58,045 |
| 2018 | $1,387 | $69,904 | $14,350 | $55,554 |
| 2017 | $2,070 | $70,576 | $14,350 | $56,226 |
| 2016 | $1,314 | $62,642 | $10,500 | $52,142 |
| 2015 | $1,311 | $50,946 | $8,400 | $42,546 |
| 2014 | $1,272 | $42,094 | $5,250 | $36,844 |
Source: Public Records
Map
Nearby Homes
- 4801 Pagosa Springs Dr
- 4832 Englewood Ave
- 4732 Lone Grove Dr
- 4895 Jubilee Diamond Ct
- 8175 Arville St Unit 99
- 8175 Arville St Unit 41
- 8175 Arville St Unit 315
- 8175 Arville St Unit 271
- 8175 Arville St Unit 171
- 8175 Arville St Unit 70
- 8175 Arville St Unit 300
- 8175 Arville St Unit 218
- 8175 Arville St Unit 1
- 8175 Arville St Unit 142
- 8175 Arville St Unit 109
- 8175 Arville St Unit 141
- 8175 Arville St Unit 49
- 8175 Arville St Unit 319
- 8175 Arville St Unit 295
- 8175 Arville St Unit 404
- 4655 Englewood Ave
- 4677 Englewood Ave
- 4687 Englewood Ave Unit 1
- 4643 Englewood Ave Unit 1
- 4668 Pagosa Springs Dr Unit 1
- 4631 Englewood Ave
- 4656 Pagosa Springs Dr
- 4678 Pagosa Springs Dr Unit 1
- 4697 Englewood Ave
- 4688 Pagosa Springs Dr
- 4644 Pagosa Springs Dr
- 4644 Pagosa Springs Dr Unit n/a
- 7989 Marble City Ct
- 4707 Englewood Ave
- 4632 Pagosa Springs Dr
- 4698 Pagosa Springs Dr
- 4619 Englewood Ave
- 7983 Marble City Ct
- 4708 Pagosa Springs Dr
- 4717 Englewood Ave Unit 1