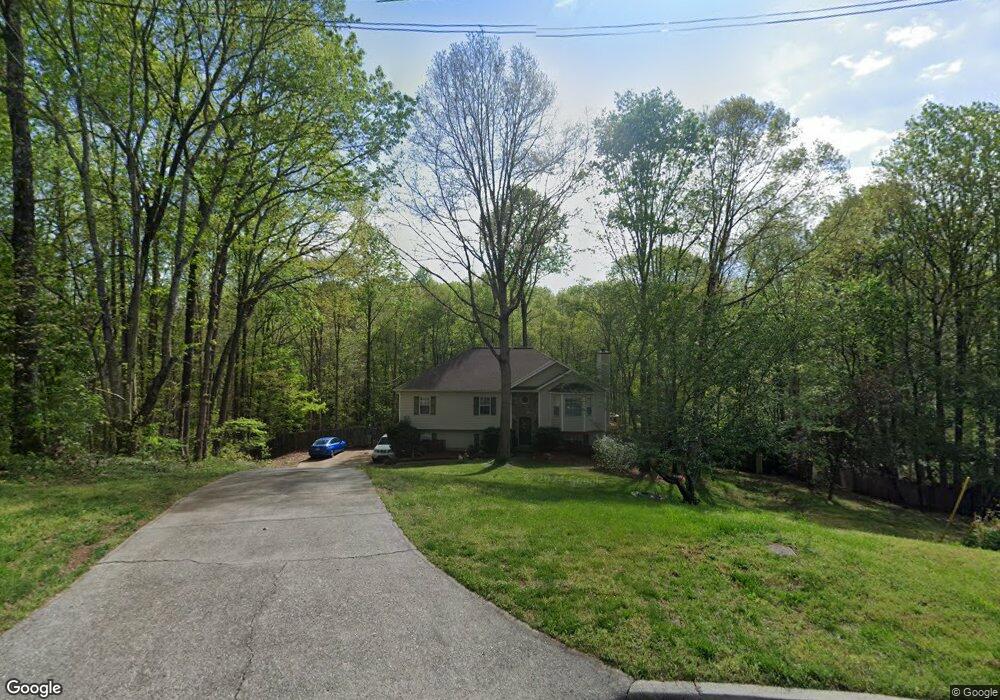
4668 Fox Forrest Dr Flowery Branch, GA 30542
Estimated Value: $350,936 - $420,000
3
Beds
3
Baths
1,577
Sq Ft
$241/Sq Ft
Est. Value
About This Home
This home is located at 4668 Fox Forrest Dr, Flowery Branch, GA 30542 and is currently estimated at $380,734, approximately $241 per square foot. 4668 Fox Forrest Dr is a home located in Hall County with nearby schools including Martin Elementary School, Southwest Middle School, and C.W. Davis Middle School.
Ownership History
Date
Name
Owned For
Owner Type
Purchase Details
Closed on
Nov 10, 2005
Sold by
Gayle Brian Eugene and Gayle Stephanie Hope
Bought by
Bierkamp Robert B and Bierkamp Annette L
Current Estimated Value
Home Financials for this Owner
Home Financials are based on the most recent Mortgage that was taken out on this home.
Original Mortgage
$127,500
Outstanding Balance
$69,261
Interest Rate
5.9%
Mortgage Type
New Conventional
Estimated Equity
$311,473
Purchase Details
Closed on
Apr 24, 1998
Sold by
Ltm Builders Inc
Bought by
Gayle Brian E and Gayle Stephanie H
Home Financials for this Owner
Home Financials are based on the most recent Mortgage that was taken out on this home.
Original Mortgage
$121,100
Interest Rate
7.03%
Mortgage Type
New Conventional
Purchase Details
Closed on
Sep 11, 1997
Sold by
R & M Developers Inc
Bought by
L T M Builders Inc
Create a Home Valuation Report for This Property
The Home Valuation Report is an in-depth analysis detailing your home's value as well as a comparison with similar homes in the area
Home Values in the Area
Average Home Value in this Area
Purchase History
| Date | Buyer | Sale Price | Title Company |
|---|---|---|---|
| Bierkamp Robert B | $170,000 | -- | |
| Gayle Brian E | $127,500 | -- | |
| L T M Builders Inc | $21,500 | -- |
Source: Public Records
Mortgage History
| Date | Status | Borrower | Loan Amount |
|---|---|---|---|
| Open | Bierkamp Robert B | $127,500 | |
| Previous Owner | Gayle Brian E | $121,100 |
Source: Public Records
Tax History Compared to Growth
Tax History
| Year | Tax Paid | Tax Assessment Tax Assessment Total Assessment is a certain percentage of the fair market value that is determined by local assessors to be the total taxable value of land and additions on the property. | Land | Improvement |
|---|---|---|---|---|
| 2024 | $3,014 | $118,520 | $21,680 | $96,840 |
| 2023 | $2,632 | $118,760 | $21,960 | $96,800 |
| 2022 | $2,842 | $107,080 | $21,960 | $85,120 |
| 2021 | $2,843 | $104,280 | $20,040 | $84,240 |
| 2020 | $2,333 | $83,320 | $10,680 | $72,640 |
| 2019 | $2,220 | $78,480 | $10,680 | $67,800 |
| 2018 | $2,124 | $72,600 | $9,720 | $62,880 |
| 2017 | $1,646 | $56,240 | $9,720 | $46,520 |
| 2016 | $1,609 | $58,240 | $9,720 | $48,520 |
| 2015 | $1,305 | $58,240 | $9,720 | $48,520 |
| 2014 | $1,305 | $60,040 | $11,440 | $48,600 |
Source: Public Records
Map
Nearby Homes
- 5157 Glen Forrest Dr
- 5129 Glen Forrest Dr
- 5641 Wooded Valley Way
- 6512 Shady Valley Dr
- 5610 Wooded Valley Way
- 5325 Highpoint Rd
- 5306 Highpoint Rd
- 5536 Rolling Mist Ct
- 5540 Rolling Mist Ct
- 5021 Limerick Ln
- 6229 Ivy Springs Dr
- 5505 Riverchase Dr
- 4826 Rose Heights Dr
- 6315 Spout Springs Rd
- 5059 Lancashire Ct
- 4827 Daintree Ct
- 4947 Cash Rd
- 4671 Fox Forrest Dr
- 4662 Fox Forrest Dr
- 6429 Flat Rock Dr
- 4667 Fox Forrest Dr
- 4658 Fox Forrest Dr
- 6426 Flat Rock Dr
- 6425 Flat Rock Dr
- 6425 Flat Rock Dr Unit 39
- 4888 Hunt Club Dr
- 4663 Fox Forrest Dr
- 4883 Hunt Club Dr
- 5186 Glen Forrest Dr
- 5182 Glen Forrest Dr
- 6422 Flat Rock Dr
- 4650 Fox Forrest Dr
- 4659 Fox Forrest Dr
- 4879 Hunt Club Dr
- 4884 Hunt Club Dr
- 6491 Ivy Springs Dr
- 6418 Flat Rock Dr