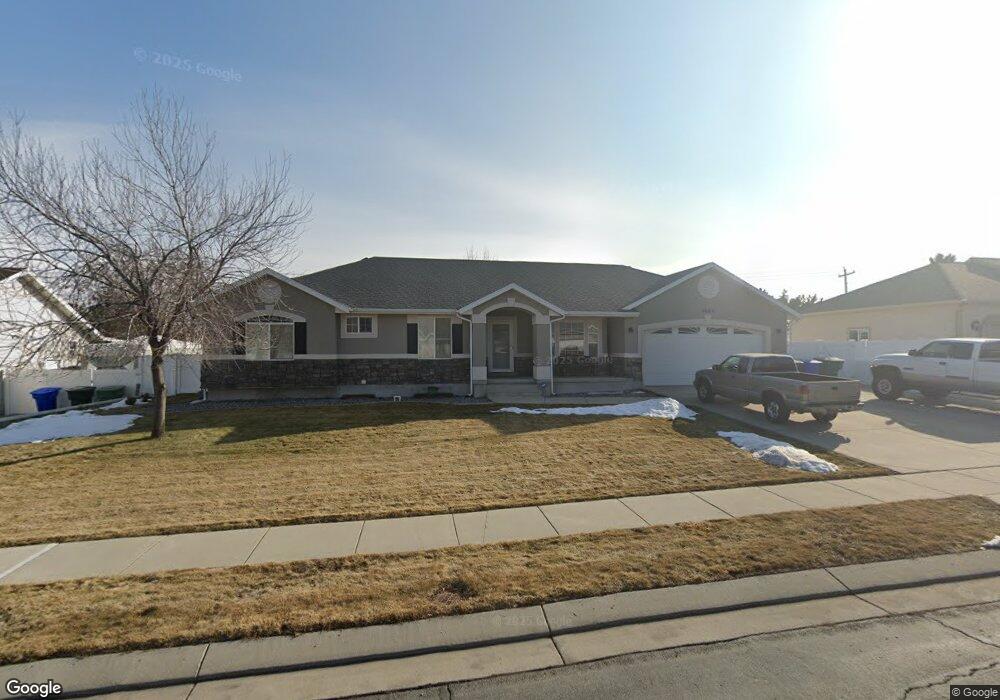
4669 W Aire Dr West Jordan, UT 84088
Cobble Creek NeighborhoodEstimated Value: $661,000 - $682,000
6
Beds
3
Baths
3,330
Sq Ft
$201/Sq Ft
Est. Value
About This Home
This home is located at 4669 W Aire Dr, West Jordan, UT 84088 and is currently estimated at $670,698, approximately $201 per square foot. 4669 W Aire Dr is a home located in Salt Lake County with nearby schools including Hayden Peak Elementary School, West Hills Middle School, and Copper Hills High School.
Ownership History
Date
Name
Owned For
Owner Type
Purchase Details
Closed on
Nov 9, 2023
Sold by
E Patricia Nielson Revocable Living Trus
Bought by
Martin Danika B and Martin Jordon F
Current Estimated Value
Home Financials for this Owner
Home Financials are based on the most recent Mortgage that was taken out on this home.
Original Mortgage
$494,505
Outstanding Balance
$481,984
Interest Rate
5.49%
Mortgage Type
FHA
Estimated Equity
$188,714
Purchase Details
Closed on
Oct 7, 2015
Sold by
Gale Michael
Bought by
Nielson E Patricia
Purchase Details
Closed on
Aug 6, 1999
Sold by
Peterson Brandon
Bought by
Gale Michael
Home Financials for this Owner
Home Financials are based on the most recent Mortgage that was taken out on this home.
Original Mortgage
$101,440
Interest Rate
7.64%
Create a Home Valuation Report for This Property
The Home Valuation Report is an in-depth analysis detailing your home's value as well as a comparison with similar homes in the area
Home Values in the Area
Average Home Value in this Area
Purchase History
| Date | Buyer | Sale Price | Title Company |
|---|---|---|---|
| Martin Danika B | -- | Old Republic Title | |
| Nielson E Patricia | -- | Surety Title | |
| Gale Michael | -- | Superior Title | |
| Peterson Brandon | -- | Superior Title |
Source: Public Records
Mortgage History
| Date | Status | Borrower | Loan Amount |
|---|---|---|---|
| Open | Martin Danika B | $494,505 | |
| Closed | Martin Danika B | $20,000 | |
| Previous Owner | Gale Michael | $101,440 |
Source: Public Records
Tax History Compared to Growth
Tax History
| Year | Tax Paid | Tax Assessment Tax Assessment Total Assessment is a certain percentage of the fair market value that is determined by local assessors to be the total taxable value of land and additions on the property. | Land | Improvement |
|---|---|---|---|---|
| 2025 | $3,246 | $630,300 | $160,900 | $469,400 |
| 2024 | $3,246 | $624,500 | $159,300 | $465,200 |
| 2023 | $3,268 | $592,500 | $150,300 | $442,200 |
| 2022 | $3,362 | $599,800 | $147,300 | $452,500 |
| 2021 | $2,729 | $443,200 | $114,500 | $328,700 |
| 2020 | $2,545 | $387,900 | $114,500 | $273,400 |
| 2019 | $2,512 | $375,400 | $108,100 | $267,300 |
| 2018 | $2,383 | $353,300 | $108,100 | $245,200 |
| 2017 | $2,281 | $336,600 | $108,100 | $228,500 |
| 2016 | $2,112 | $292,800 | $108,100 | $184,700 |
| 2015 | $2,127 | $287,600 | $114,300 | $173,300 |
| 2014 | $1,962 | $261,100 | $105,000 | $156,100 |
Source: Public Records
Map
Nearby Homes
- 4678 Emmons Dr
- 7973 S Nebo Dr
- 8359 Etude Dr
- 7903 Mckenzie Ln
- 7886 Mckenzie Ln
- 8322 Copper Vista Cir
- 7908 Cold Stone Ln Unit N3
- 5183 W Swift Water Way
- 5189 W Dove Creek Ln
- 7882 S Dove Creek Ln Unit A6
- 5228 W Ranches Loop Rd
- 7502 S Lace Wood Dr Unit 417
- 7493 S Lace Wood Dr
- 4887 W 8620 S
- 7518 Park Village Dr
- 5298 W Icehouse Way
- 8577 Autumn Gold Cir
- 3977 W Elwood Way
- 8441 S Spratling Dr
- 5422 W Island Creek Dr
- 4669 Aire Dr
- 4681 W Aire Dr
- 4681 Aire Dr
- 4657 Aire Dr
- 4672 W Aire Dr
- 4672 Aire Dr
- 4693 W Aire Dr
- 4693 Aire Dr
- 4647 Aire Dr
- 4684 Aire Dr
- 4658 W Aire Dr
- 4658 Aire Dr
- 4698 Aire Dr
- 4698 W Aire Dr
- 4637 Aire Dr
- 4705 Aire Dr
- 4705 W Aire Dr
- 4638 W Summit Valley Dr
- 4638 Summit Valley Dr
- 4648 W Summit Valley Dr