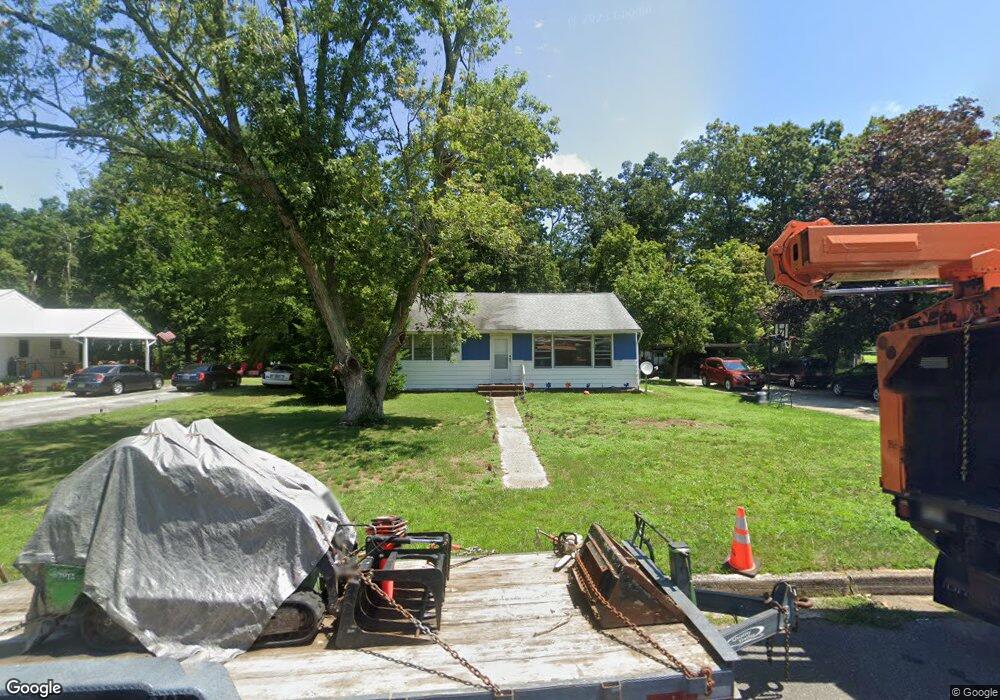
467 Cedar Ln Millville, NJ 08332
Estimated Value: $262,094 - $306,000
3
Beds
1
Bath
1,120
Sq Ft
$250/Sq Ft
Est. Value
About This Home
This home is located at 467 Cedar Ln, Millville, NJ 08332 and is currently estimated at $279,524, approximately $249 per square foot. 467 Cedar Ln is a home located in Cumberland County with nearby schools including Rieck Avenue School, Lakeside Middle School, and Memorial High School.
Ownership History
Date
Name
Owned For
Owner Type
Purchase Details
Closed on
Jul 21, 2023
Sold by
Millville Horizon Llc
Bought by
467 Cedar Lane Llc
Current Estimated Value
Home Financials for this Owner
Home Financials are based on the most recent Mortgage that was taken out on this home.
Original Mortgage
$1,600,000
Outstanding Balance
$945,684
Interest Rate
4%
Mortgage Type
Seller Take Back
Estimated Equity
-$666,160
Purchase Details
Closed on
Jul 21, 2006
Sold by
Buffaloe Theodore L
Bought by
Millville Horizon Llc
Create a Home Valuation Report for This Property
The Home Valuation Report is an in-depth analysis detailing your home's value as well as a comparison with similar homes in the area
Home Values in the Area
Average Home Value in this Area
Purchase History
| Date | Buyer | Sale Price | Title Company |
|---|---|---|---|
| 467 Cedar Lane Llc | $398,000 | Madison Title | |
| 467 Cedar Lane Llc | $398,000 | Madison Title | |
| Millville Horizon Llc | $115,000 | -- |
Source: Public Records
Mortgage History
| Date | Status | Borrower | Loan Amount |
|---|---|---|---|
| Open | 467 Cedar Lane Llc | $1,600,000 |
Source: Public Records
Tax History Compared to Growth
Tax History
| Year | Tax Paid | Tax Assessment Tax Assessment Total Assessment is a certain percentage of the fair market value that is determined by local assessors to be the total taxable value of land and additions on the property. | Land | Improvement |
|---|---|---|---|---|
| 2025 | $3,776 | $96,200 | $39,300 | $56,900 |
| 2024 | $3,776 | $96,200 | $39,300 | $56,900 |
| 2023 | $3,744 | $96,200 | $39,300 | $56,900 |
| 2022 | $3,647 | $96,200 | $39,300 | $56,900 |
| 2021 | $3,529 | $96,200 | $39,300 | $56,900 |
| 2020 | $3,470 | $96,200 | $39,300 | $56,900 |
| 2019 | $3,309 | $96,200 | $39,300 | $56,900 |
| 2018 | $3,241 | $96,200 | $39,300 | $56,900 |
| 2017 | $3,211 | $96,200 | $39,300 | $56,900 |
| 2016 | $3,171 | $96,200 | $39,300 | $56,900 |
| 2015 | $3,100 | $96,200 | $39,300 | $56,900 |
| 2014 | $3,105 | $96,200 | $39,300 | $56,900 |
Source: Public Records
Map
Nearby Homes