Estimated Value: $289,000 - $321,000
4
Beds
2
Baths
2,362
Sq Ft
$129/Sq Ft
Est. Value
About This Home
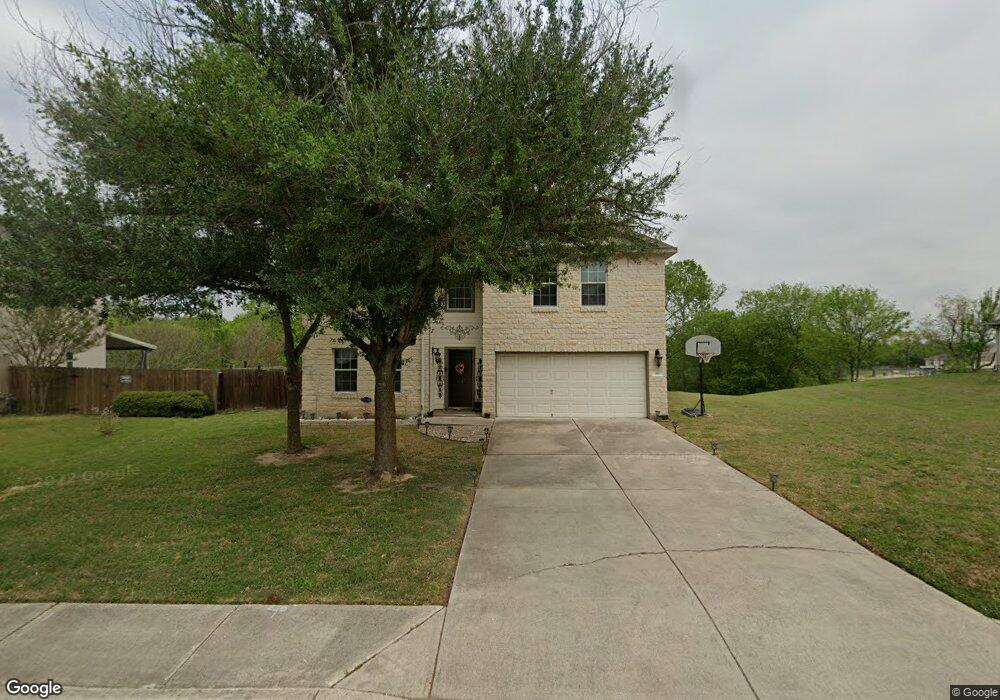
This home is located at 467 Dandelion Loop, Kyle, TX 78640 and is currently estimated at $305,345, approximately $129 per square foot. 467 Dandelion Loop is a home located in Hays County with nearby schools including Ralph Pfluger Elementary School, Armando Chapa Middle School, and Lehman High School.
Ownership History
Date
Name
Owned For
Owner Type
Purchase Details
Closed on
Jan 12, 2005
Sold by
Jones Brian Christopher
Bought by
Jones Robyn Noelle
Current Estimated Value
Purchase Details
Closed on
Mar 24, 2004
Sold by
Lennar Homes Of Texas Sales & Marketing Ltd T
Bought by
Jones Robyn Noelle
Home Financials for this Owner
Home Financials are based on the most recent Mortgage that was taken out on this home.
Original Mortgage
$130,639
Outstanding Balance
$60,246
Interest Rate
5.59%
Mortgage Type
FHA
Estimated Equity
$245,099
Create a Home Valuation Report for This Property
The Home Valuation Report is an in-depth analysis detailing your home's value as well as a comparison with similar homes in the area
Home Values in the Area
Average Home Value in this Area
Purchase History
| Date | Buyer | Sale Price | Title Company |
|---|---|---|---|
| Jones Robyn Noelle | -- | -- | |
| Jones Robyn Noelle | -- | -- | |
| Jones Brian C | -- | North American Title | |
| Lennar Homes Of Texas Sales & Mktg Ltd | -- | North American Title |
Source: Public Records
Mortgage History
| Date | Status | Borrower | Loan Amount |
|---|---|---|---|
| Open | Jones Brian C | $130,639 | |
| Closed | Jones Robyn Noelle | $0 |
Source: Public Records
Tax History
| Year | Tax Paid | Tax Assessment Tax Assessment Total Assessment is a certain percentage of the fair market value that is determined by local assessors to be the total taxable value of land and additions on the property. | Land | Improvement |
|---|---|---|---|---|
| 2025 | $2,062 | $296,007 | -- | -- |
| 2024 | $61 | $269,097 | $65,840 | $203,257 |
| 2023 | $5,898 | $264,000 | $76,460 | $236,350 |
| 2022 | $5,841 | $240,000 | $64,800 | $175,200 |
| 2021 | $6,152 | $231,847 | $39,200 | $199,720 |
| 2019 | $5,764 | $208,650 | $27,900 | $180,750 |
| 2018 | $5,354 | $193,310 | $18,000 | $180,080 |
| 2017 | $4,954 | $175,736 | $18,000 | $165,590 |
| 2016 | $4,504 | $159,760 | $18,000 | $141,760 |
| 2015 | $2,975 | $145,590 | $15,000 | $130,590 |
Source: Public Records
Map
Nearby Homes
- 245 Peppergrass Cove
- 197 Peppergrass Cove
- 173 Peppergrass Cove
- 1251 Amberwood Loop
- 184 Dandelion Loop
- 1148 Amberwood Loop
- 1329 Amberwood Loop
- 261 Amber Ash Dr
- 282 Crimson Ln
- 239 Crimson Ln
- 158 Crimson Ln
- 113 Screech Owl Dr
- 100 Pecanwood S
- 101 Crimson Ln
- 195 Azure Cove
- 1681 Amberwood Loop
- 40 Eagle Creek 244 Dr
- 305 Reef Band Dr
- 151 Gold Canyon Dr Unit 152
- 142 Eagle Creek Dr
- 449 Dandelion Loop
- 485 Dandelion Loop
- 497 Dandelion Loop
- 113 Prairie Verbena Dr
- 437 Dandelion Loop
- 125 Prairie Verbena Dr
- 430 Dandelion Loop
- 515 Dandelion Loop
- 137 Prairie Verbena Dr
- 425 Dandelion Loop
- 514 Dandelion Loop
- 406 Dandelion Loop
- 149 Prairie Verbena Dr
- 413 Dandelion Loop
- 527 Dandelion Loop
- 526 Dandelion Loop
- 394 Dandelion Loop
- 401 Dandelion Loop
- 113 Buttercup Way
- 539 Dandelion Loop
Your Personal Tour Guide
Ask me questions while you tour the home.