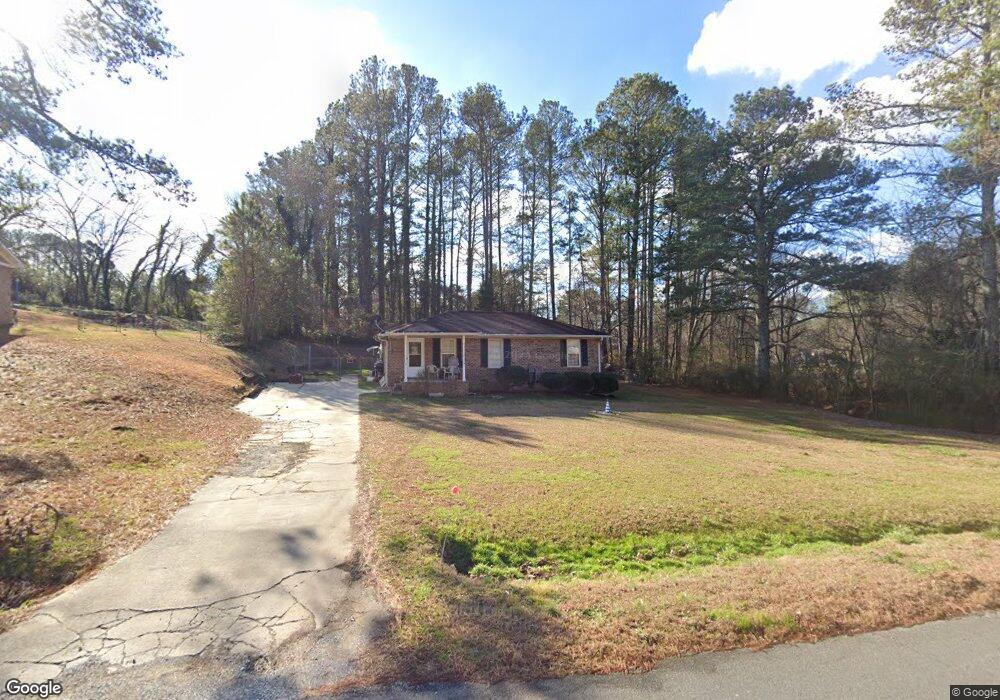
467 Donahoo Rd SE Silver Creek, GA 30173
Estimated Value: $152,363 - $198,000
--
Bed
--
Bath
1,217
Sq Ft
$146/Sq Ft
Est. Value
About This Home
This home is located at 467 Donahoo Rd SE, Silver Creek, GA 30173 and is currently estimated at $177,341, approximately $145 per square foot. 467 Donahoo Rd SE is a home located in Floyd County with nearby schools including Pepperell Middle School and Pepperell High School.
Ownership History
Date
Name
Owned For
Owner Type
Purchase Details
Closed on
Jan 17, 2018
Sold by
Smith Felicia G
Bought by
Redden Felicia Gwen
Current Estimated Value
Home Financials for this Owner
Home Financials are based on the most recent Mortgage that was taken out on this home.
Original Mortgage
$48,750
Outstanding Balance
$27,409
Interest Rate
3.94%
Mortgage Type
New Conventional
Estimated Equity
$149,932
Purchase Details
Closed on
Aug 28, 1997
Sold by
Bailey Beverly
Bought by
Smith Felicia G
Purchase Details
Closed on
May 21, 1990
Sold by
Dees Roger D
Bought by
Bailey Beverly
Purchase Details
Closed on
Aug 9, 1988
Sold by
Jones Joel L and Birdsong James H
Bought by
Dees Roger D
Purchase Details
Closed on
Sep 18, 1981
Sold by
Morgan John S
Bought by
Jones Joel L and Birdsong James H
Purchase Details
Closed on
Nov 8, 1978
Sold by
Hoyers James E
Bought by
Morgan John S
Purchase Details
Closed on
Nov 14, 1974
Bought by
Hoyers James E
Create a Home Valuation Report for This Property
The Home Valuation Report is an in-depth analysis detailing your home's value as well as a comparison with similar homes in the area
Home Values in the Area
Average Home Value in this Area
Purchase History
| Date | Buyer | Sale Price | Title Company |
|---|---|---|---|
| Redden Felicia Gwen | -- | -- | |
| Smith Felicia G | $47,500 | -- | |
| Bailey Beverly | $39,900 | -- | |
| Dees Roger D | $33,900 | -- | |
| Jones Joel L | $27,600 | -- | |
| Morgan John S | $24,000 | -- | |
| Hoyers James E | $24,900 | -- |
Source: Public Records
Mortgage History
| Date | Status | Borrower | Loan Amount |
|---|---|---|---|
| Open | Redden Felicia Gwen | $48,750 |
Source: Public Records
Tax History Compared to Growth
Tax History
| Year | Tax Paid | Tax Assessment Tax Assessment Total Assessment is a certain percentage of the fair market value that is determined by local assessors to be the total taxable value of land and additions on the property. | Land | Improvement |
|---|---|---|---|---|
| 2024 | $1,666 | $51,751 | $6,125 | $45,626 |
| 2023 | $1,547 | $50,110 | $5,568 | $44,542 |
| 2022 | $1,180 | $37,501 | $4,550 | $32,951 |
| 2021 | $961 | $29,688 | $4,149 | $25,539 |
| 2020 | $913 | $27,966 | $3,608 | $24,358 |
| 2019 | $861 | $26,754 | $3,608 | $23,146 |
| 2018 | $746 | $22,949 | $3,436 | $19,513 |
| 2017 | $722 | $22,108 | $3,182 | $18,926 |
| 2016 | $703 | $21,182 | $3,160 | $18,022 |
| 2015 | $690 | $21,182 | $3,160 | $18,022 |
| 2014 | $690 | $21,182 | $3,160 | $18,022 |
Source: Public Records
Map
Nearby Homes
- 1531 Old Rockmart Rd SE
- 550 Donahoo Rd SE
- 23 Rainwood Cir SE
- 4855 Rockmart Rd SE
- 13 Rainwood Dr SE
- 290 Donahoo Rd SE
- 7 Timberwood Dr SE
- 697A Donahoo Rd SE
- 4622 Rockmart Rd SE
- 16 Timberwood Dr SE
- 22 Timberwood Dr SE
- 62 Ramblewood Dr SE
- 421 Wax Rd SE
- 37 Ramblewood Dr SE
- 504 Rockmart Rd SE
- 2 Silvermont Dr SE
- 0 Wedgewood Dr
- 682 Wax Rd SE
- 457 Donahoo Rd SE
- 480 Donahoo Rd SE
- 8 Raintree Dr SE
- 8 Raintree Dr SE
- 447 Donahoo Rd SE
- 6 Raintree Dr SE
- 460 Donahoo Rd SE
- 495 Donahoo Rd SE
- 4 Raintree Dr SE
- 478 Donahoo Rd SE
- 12 Raintree Dr SE
- 1476 Old Rockmart Rd SE
- 494 Donahoo Rd SE
- 511 Donahoo Rd SE
- 2 Raintree Dr SE
- 5 Raintree Dr SE
- 9 Raintree Dr SE
- 7 Raintree Dr SE
- 423 Donahoo Rd SE
- 512 Donahoo Rd SE