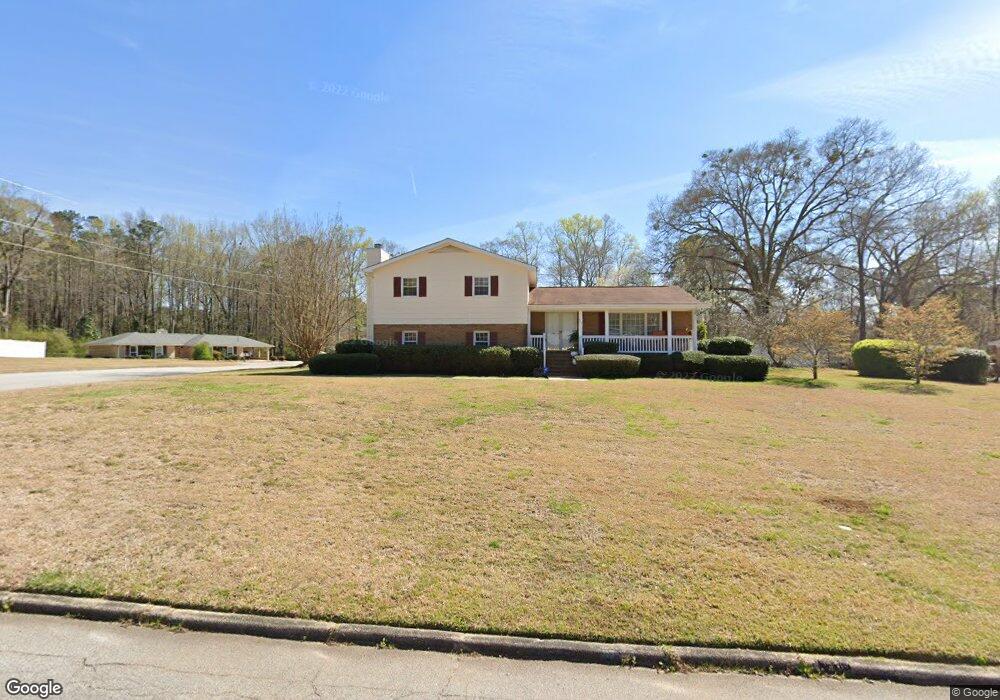
467 Hickory Terrace Lagrange, GA 30241
Estimated Value: $239,954 - $311,000
4
Beds
3
Baths
2,420
Sq Ft
$110/Sq Ft
Est. Value
About This Home
This home is located at 467 Hickory Terrace, Lagrange, GA 30241 and is currently estimated at $266,739, approximately $110 per square foot. 467 Hickory Terrace is a home located in Troup County with nearby schools including Franklin Forest Elementary School, Hollis Hand Elementary School, and Ethel W. Kight Elementary School.
Ownership History
Date
Name
Owned For
Owner Type
Purchase Details
Closed on
Nov 16, 2018
Sold by
Winston Jarrell
Bought by
Winston Jarrell and Winston Marlene R
Current Estimated Value
Purchase Details
Closed on
Apr 4, 2008
Sold by
Winston Jarrell
Bought by
Winston Jarrell and Winston Marlene
Purchase Details
Closed on
Mar 5, 1998
Sold by
Deborah C Ralston
Bought by
Winston Jarrell
Purchase Details
Closed on
Jul 25, 1996
Sold by
Edwin David Mills
Bought by
Deborah C Ralston
Purchase Details
Closed on
Jun 1, 1985
Sold by
Neil Sherrod J
Bought by
Edwin David Mills
Purchase Details
Closed on
Jul 1, 1970
Sold by
Grady S Smith
Bought by
Neil Sherrod J
Purchase Details
Closed on
Oct 1, 1969
Sold by
James L Sherrill
Bought by
Grady S Smith
Purchase Details
Closed on
Sep 1, 1968
Sold by
Roy M Waller
Bought by
James L Sherrill
Create a Home Valuation Report for This Property
The Home Valuation Report is an in-depth analysis detailing your home's value as well as a comparison with similar homes in the area
Purchase History
| Date | Buyer | Sale Price | Title Company |
|---|---|---|---|
| Winston Jarrell | -- | -- | |
| Winston Jarrell | -- | -- | |
| Winston Jarrell | $99,800 | -- | |
| Deborah C Ralston | $94,000 | -- | |
| Edwin David Mills | $84,000 | -- | |
| Neil Sherrod J | -- | -- | |
| Grady S Smith | -- | -- | |
| James L Sherrill | -- | -- |
Source: Public Records
Tax History
| Year | Tax Paid | Tax Assessment Tax Assessment Total Assessment is a certain percentage of the fair market value that is determined by local assessors to be the total taxable value of land and additions on the property. | Land | Improvement |
|---|---|---|---|---|
| 2025 | $2,647 | $97,068 | $10,000 | $87,068 |
| 2024 | $2,279 | $83,576 | $10,000 | $73,576 |
| 2023 | $2,134 | $78,228 | $10,000 | $68,228 |
| 2022 | $2,073 | $74,268 | $10,000 | $64,268 |
| 2021 | $1,665 | $55,200 | $8,000 | $47,200 |
| 2020 | $1,665 | $55,200 | $8,000 | $47,200 |
| 2019 | $1,667 | $55,280 | $8,000 | $47,280 |
| 2018 | $1,484 | $51,200 | $6,800 | $44,400 |
| 2017 | $1,484 | $51,200 | $6,800 | $44,400 |
| 2016 | $1,437 | $49,616 | $6,800 | $42,816 |
| 2015 | $1,439 | $49,616 | $6,800 | $42,816 |
| 2014 | $1,373 | $47,363 | $6,800 | $40,563 |
| 2013 | -- | $49,731 | $6,800 | $42,931 |
Source: Public Records
Map
Nearby Homes
- 203 Bonaventure Dr
- 224 Rutland Cir
- 102 Dogwood Dr
- 706 N Harlem Cir
- 210 Hearthstone Dr
- 616 S Harlem Cir
- 202 Park Hill Dr
- 87 Youngs Mill Rd
- 131 Foch St
- 212 Cleveland Dr
- 204 Cleveland Dr
- 115 Clara Jean Ct
- 110 Lenox Cir
- 806 New Franklin Rd
- 114 Briarcliff Rd
- 900 North St
- 110 Russell St
- 121 de Groat St
- 107 N Barnard Ave
- 204 Colonial St
- 465 Hickory Terrace
- 501 Hickory Terrace
- 501 Hickory Terrace Unit 1
- 470 Hickory Terrace
- 469 Camelot Ct
- 471 Camelot Ct
- 468 Hickory Terrace
- 473 Camelot Ct
- 473 Camelot Ct Unit 26
- 361 Hickory Terrace
- 466 Hickory Terrace Unit 32
- 466 Hickory Terrace
- 500 Hickory Terrace
- 401 Camelot Dr
- 401 Camelot Dr Unit 50
- 464 Hickory Terrace
- 400 Camelot Dr
- 353 Hickory Terrace
- 304 Valley Ct
- 403 Camelot Dr
Your Personal Tour Guide
Ask me questions while you tour the home.