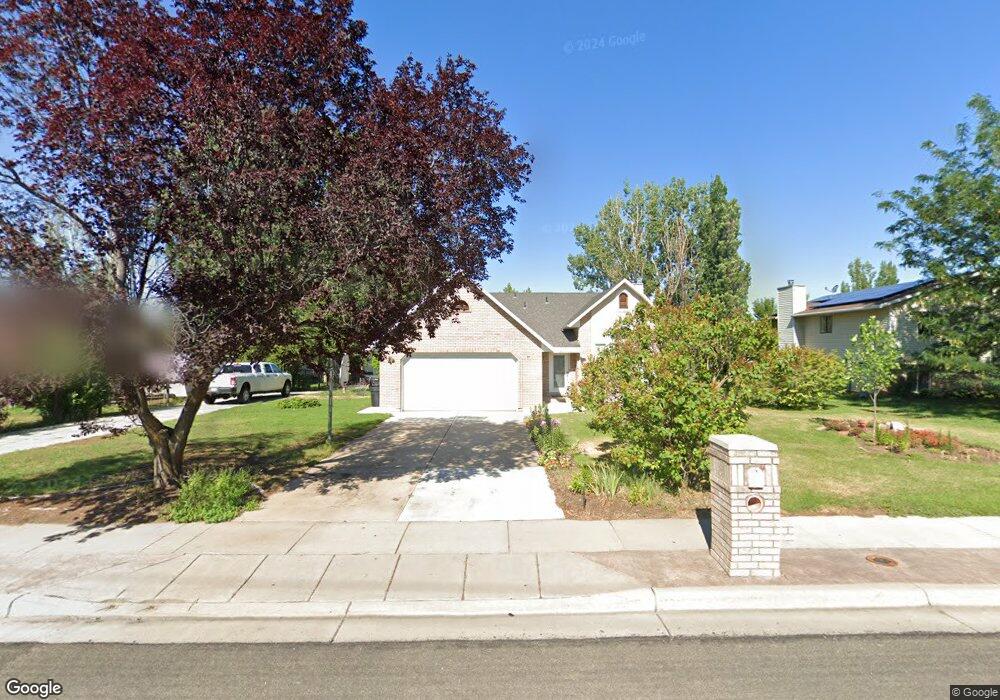
467 N 3000 W Clearfield, UT 84015
Estimated Value: $495,000 - $567,009
5
Beds
2
Baths
2,151
Sq Ft
$251/Sq Ft
Est. Value
About This Home
This home is located at 467 N 3000 W, Clearfield, UT 84015 and is currently estimated at $540,252, approximately $251 per square foot. 467 N 3000 W is a home located in Davis County with nearby schools including Lakeside School, West Point Junior High School, and Syracuse High School.
Ownership History
Date
Name
Owned For
Owner Type
Purchase Details
Closed on
Jul 2, 2020
Sold by
Martineau James and Martineau Jennifer Anne
Bought by
Martineau James and Martineau Jennifer
Current Estimated Value
Purchase Details
Closed on
Mar 9, 2005
Sold by
Twitchell Diana and Twitchell Diana M
Bought by
Martineau James
Purchase Details
Closed on
Feb 24, 2003
Sold by
Twitchell Diana M and Draper Diane M
Bought by
Martinaeu James
Home Financials for this Owner
Home Financials are based on the most recent Mortgage that was taken out on this home.
Original Mortgage
$155,800
Interest Rate
5.93%
Purchase Details
Closed on
Jun 27, 2002
Sold by
West Point Prud Llc
Bought by
Twitchell Diana and Twitchell Diana M
Create a Home Valuation Report for This Property
The Home Valuation Report is an in-depth analysis detailing your home's value as well as a comparison with similar homes in the area
Home Values in the Area
Average Home Value in this Area
Purchase History
| Date | Buyer | Sale Price | Title Company |
|---|---|---|---|
| Martineau James | -- | None Available | |
| Martineau James | -- | Heritage West Title Ins Agen | |
| Martineau James | -- | Heritage West Title Ins Agen | |
| Martinaeu James | -- | Heritage West Title Insuranc | |
| Twitchell Diana | -- | -- |
Source: Public Records
Mortgage History
| Date | Status | Borrower | Loan Amount |
|---|---|---|---|
| Previous Owner | Martinaeu James | $155,800 |
Source: Public Records
Tax History Compared to Growth
Tax History
| Year | Tax Paid | Tax Assessment Tax Assessment Total Assessment is a certain percentage of the fair market value that is determined by local assessors to be the total taxable value of land and additions on the property. | Land | Improvement |
|---|---|---|---|---|
| 2025 | $2,976 | $278,850 | $129,177 | $149,673 |
| 2024 | $2,787 | $262,350 | $116,062 | $146,288 |
| 2023 | $2,564 | $444,000 | $199,556 | $244,444 |
| 2022 | $2,751 | $260,700 | $109,431 | $151,269 |
| 2021 | $2,461 | $349,000 | $149,989 | $199,011 |
| 2020 | $2,173 | $304,000 | $129,638 | $174,362 |
| 2019 | $2,095 | $289,000 | $124,680 | $164,320 |
| 2018 | $1,919 | $261,000 | $116,908 | $144,092 |
| 2016 | $1,645 | $117,700 | $45,566 | $72,134 |
| 2015 | $1,557 | $105,600 | $38,732 | $66,868 |
| 2014 | $1,555 | $106,942 | $38,732 | $68,210 |
| 2013 | -- | $103,753 | $52,313 | $51,440 |
Source: Public Records
Map
Nearby Homes
- 488 N 3100 W
- 3187 W 525 N
- 3212 W 600 N
- 399 N 3425 W
- 2633 N 2080 W Unit 180
- 2623 N 2080 W Unit 178
- 380 S 4300 W Unit 608
- 997 N 5100 W Unit 213
- 2619 N 2080 W Unit 177
- 2627 N 2080 W Unit 179
- 3232 W 375 N Unit 7
- 3258 W 375 N Unit 9
- 260 W Antelope Dr S
- 4200 W 800 N
- 2535 W 550 N
- 2792 W 50 S
- 164 S 2875 W
- 1159 S 4350 W
- 2816 W 960 N
- 878 N 2600 W